Tracepanel for Django
See what your Django app does on every request, task and command, with its SQL, cache, templates, logs and errors.
Tracepanel records each request, Celery task and management command of your
Django app. Each trace holds its SQL queries, cache calls, Redis commands,
MongoDB queries, outgoing HTTP calls, templates, signals, emails, log lines and
errors. Tracepanel finds N+1 queries and calls, duplicate and slow SQL, large
results, slow HTTP calls, long transactions, work done before COMMIT,
blocking calls in async views and tasks that waited for a worker. Each issue
names the line of your code and the Django way to fix it, such as the
select_related() that removes an N+1.
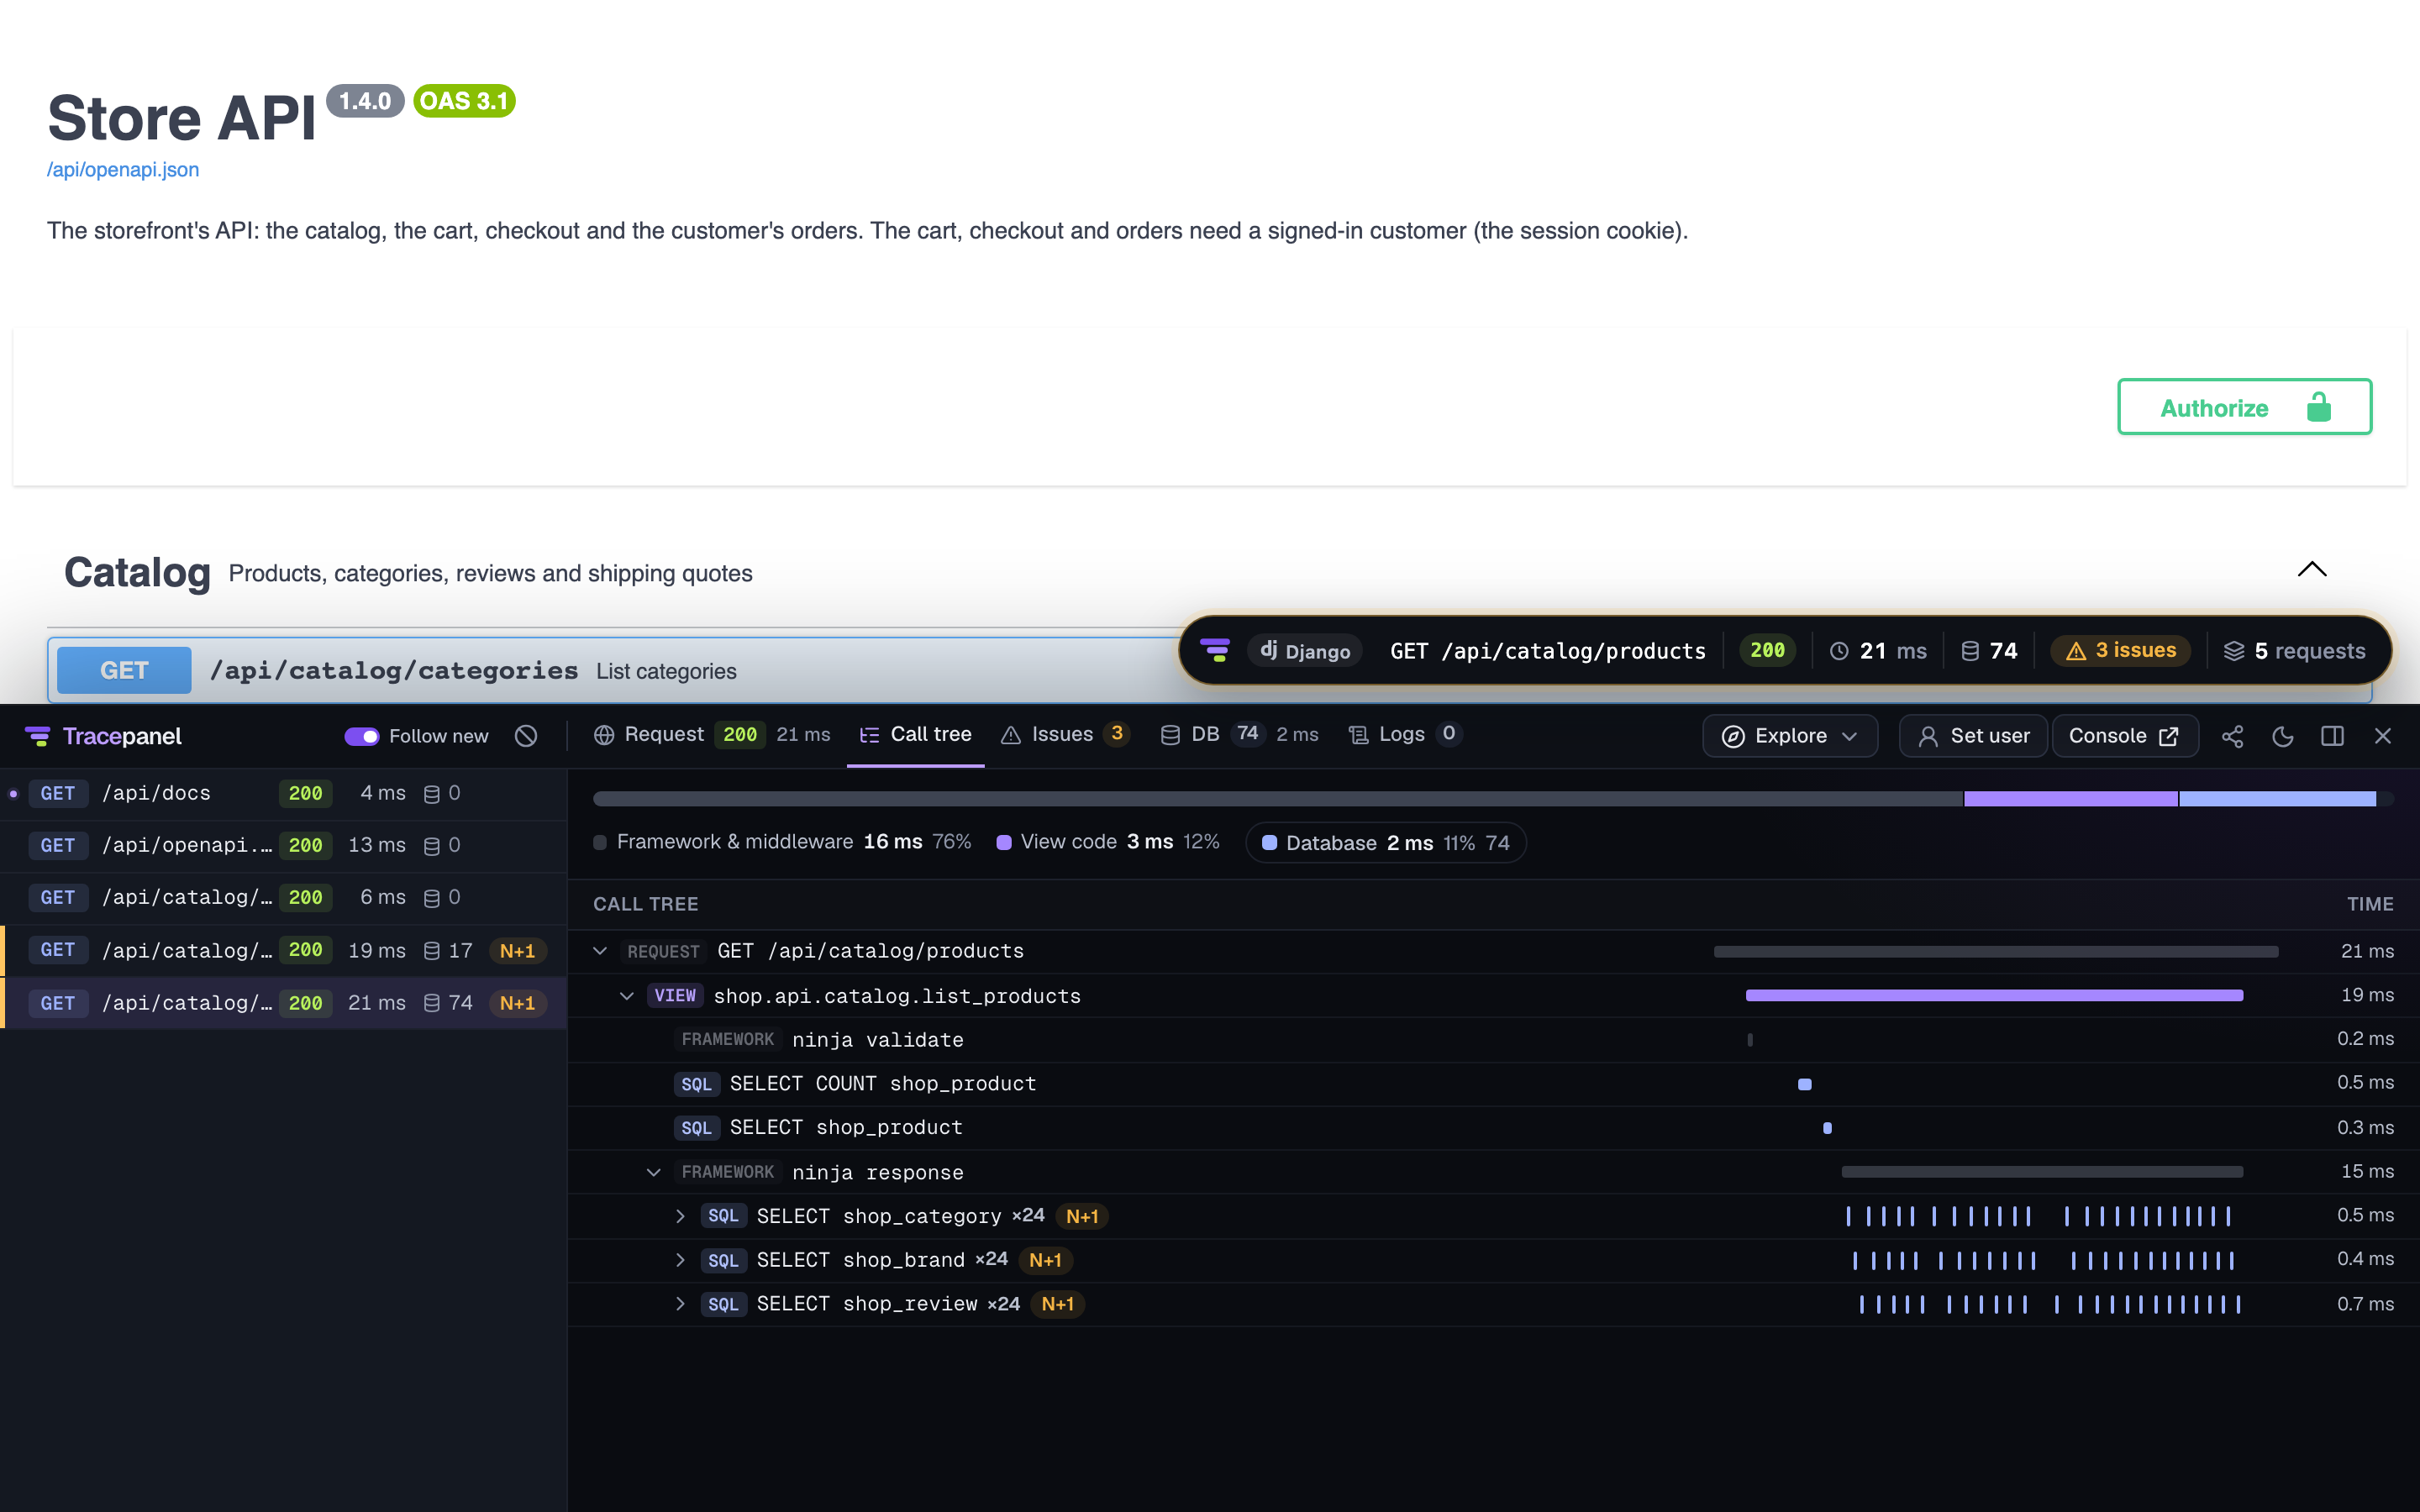
It takes one line in your settings:
pip install django-tracepanel# settings.py
INSTALLED_APPS += ["tracepanel.django"]Tracepanel is on when DEBUG = True. Open a page, and a badge in the corner
opens the panel. The console is at /__tracepanel__/. To show a teammate what
you see, Share saves a trace as one HTML file that opens in any browser.
Installation
Add the app, start the server, run workers and commands.
What it records
The ORM, transactions, templates, cache, signals, emails, calls to other services, DRF, Ninja, Channels and the task queues.
Settings
The TRACEPANEL dict, and the settings a Django project changes most.
Safety
Why it stays off outside development, what it keeps, and who can read it.
The panel, the console, the issues and the logs work the same in every framework. Their pages are in the main docs.