What it records
The parts of Django that Tracepanel records with no setup, the Django libraries it traces, and the issues it finds in them.
With tracepanel.django installed, Tracepanel records these parts of Django.
You don't configure any of them.
The ORM
Tracepanel records every SQL query on every database connection, with its
parameters, its time, the rows it returned and the line of your code that ran
it. The async ORM counts too, and Tracepanel keeps the place in your code
across sync_to_async().
From the queries, the agent finds these issues:
- N+1 queries. The same query repeated for each row, with the
select_related()orprefetch_related()that removes it. - Duplicate queries. The same query with the same parameters, more than once in a request.
- Slow SQL. A query over
slow_sql_ms. The console runsEXPLAINon it. ALIKEpattern that starts with%, ascontainsandicontainsmake, gets a hint about why no index helps. - Large results. A query without a
LIMITthat returned 1,000 rows or more. Tracepanel counts the rows as Django fetches them. The hint namesPaginator,.iterator()and.values_list().
A query that a template runs, such as a relation read inside {% for %},
shows under that template's render, so you see which template caused an N+1.
Transactions
Each atomic() block is a transaction, and a nested one is a savepoint. Each
on_commit() callback shows where it ran. The agent reports two issues here:
- Long transactions. An outer
atomic()block longer thanlong_transaction_ms, with the work inside it. - Work inside a transaction. An email sent, a task queued or an HTTP call
made before
COMMIT. If the transaction rolls back, the email is already sent. The fix istransaction.on_commit().
Views, templates and the request
Each request names its route and its view, after the view's function or class. Each template render is a step in the call tree. The panel shows the logged-in user, and a logout records the user who left.
The panel can show your site as another user. See Switching the user.
Cache, signals and emails
- Cache. Each call on every backend you create through
caches, with its key and whether it hit. On Redis, the Redis command shows inside the cache call. A cache call repeated per item is reported like an N+1, once the repeats cost 5 ms together. - Signals. Each signal with receivers in your project, with a step for
each receiver, so a slow
post_savehandler shows where it ran.pre_initandpost_initare left out: they fire for every object a query loads. - Emails. Each email sent with
send_mail(),EmailMessageorEmailMultiAlternatives, with its text and HTML. The console's Emails page lists them.
Calls to other services
Tracepanel records what your app sends to other systems, each as a step in the call tree with the line of your code that made it:
- HTTP calls from
requests,urllib3,httpxandaiohttp. A call overslow_http_msis reported as slow. - Redis commands from
redis-pyandvalkey-py, when you use Redis directly. A command repeated per item is reported like an N+1. - MongoDB queries from
pymongoand Motor. See MongoDB.
The console has a page for each system your app called, with the calls, their time and the failures.
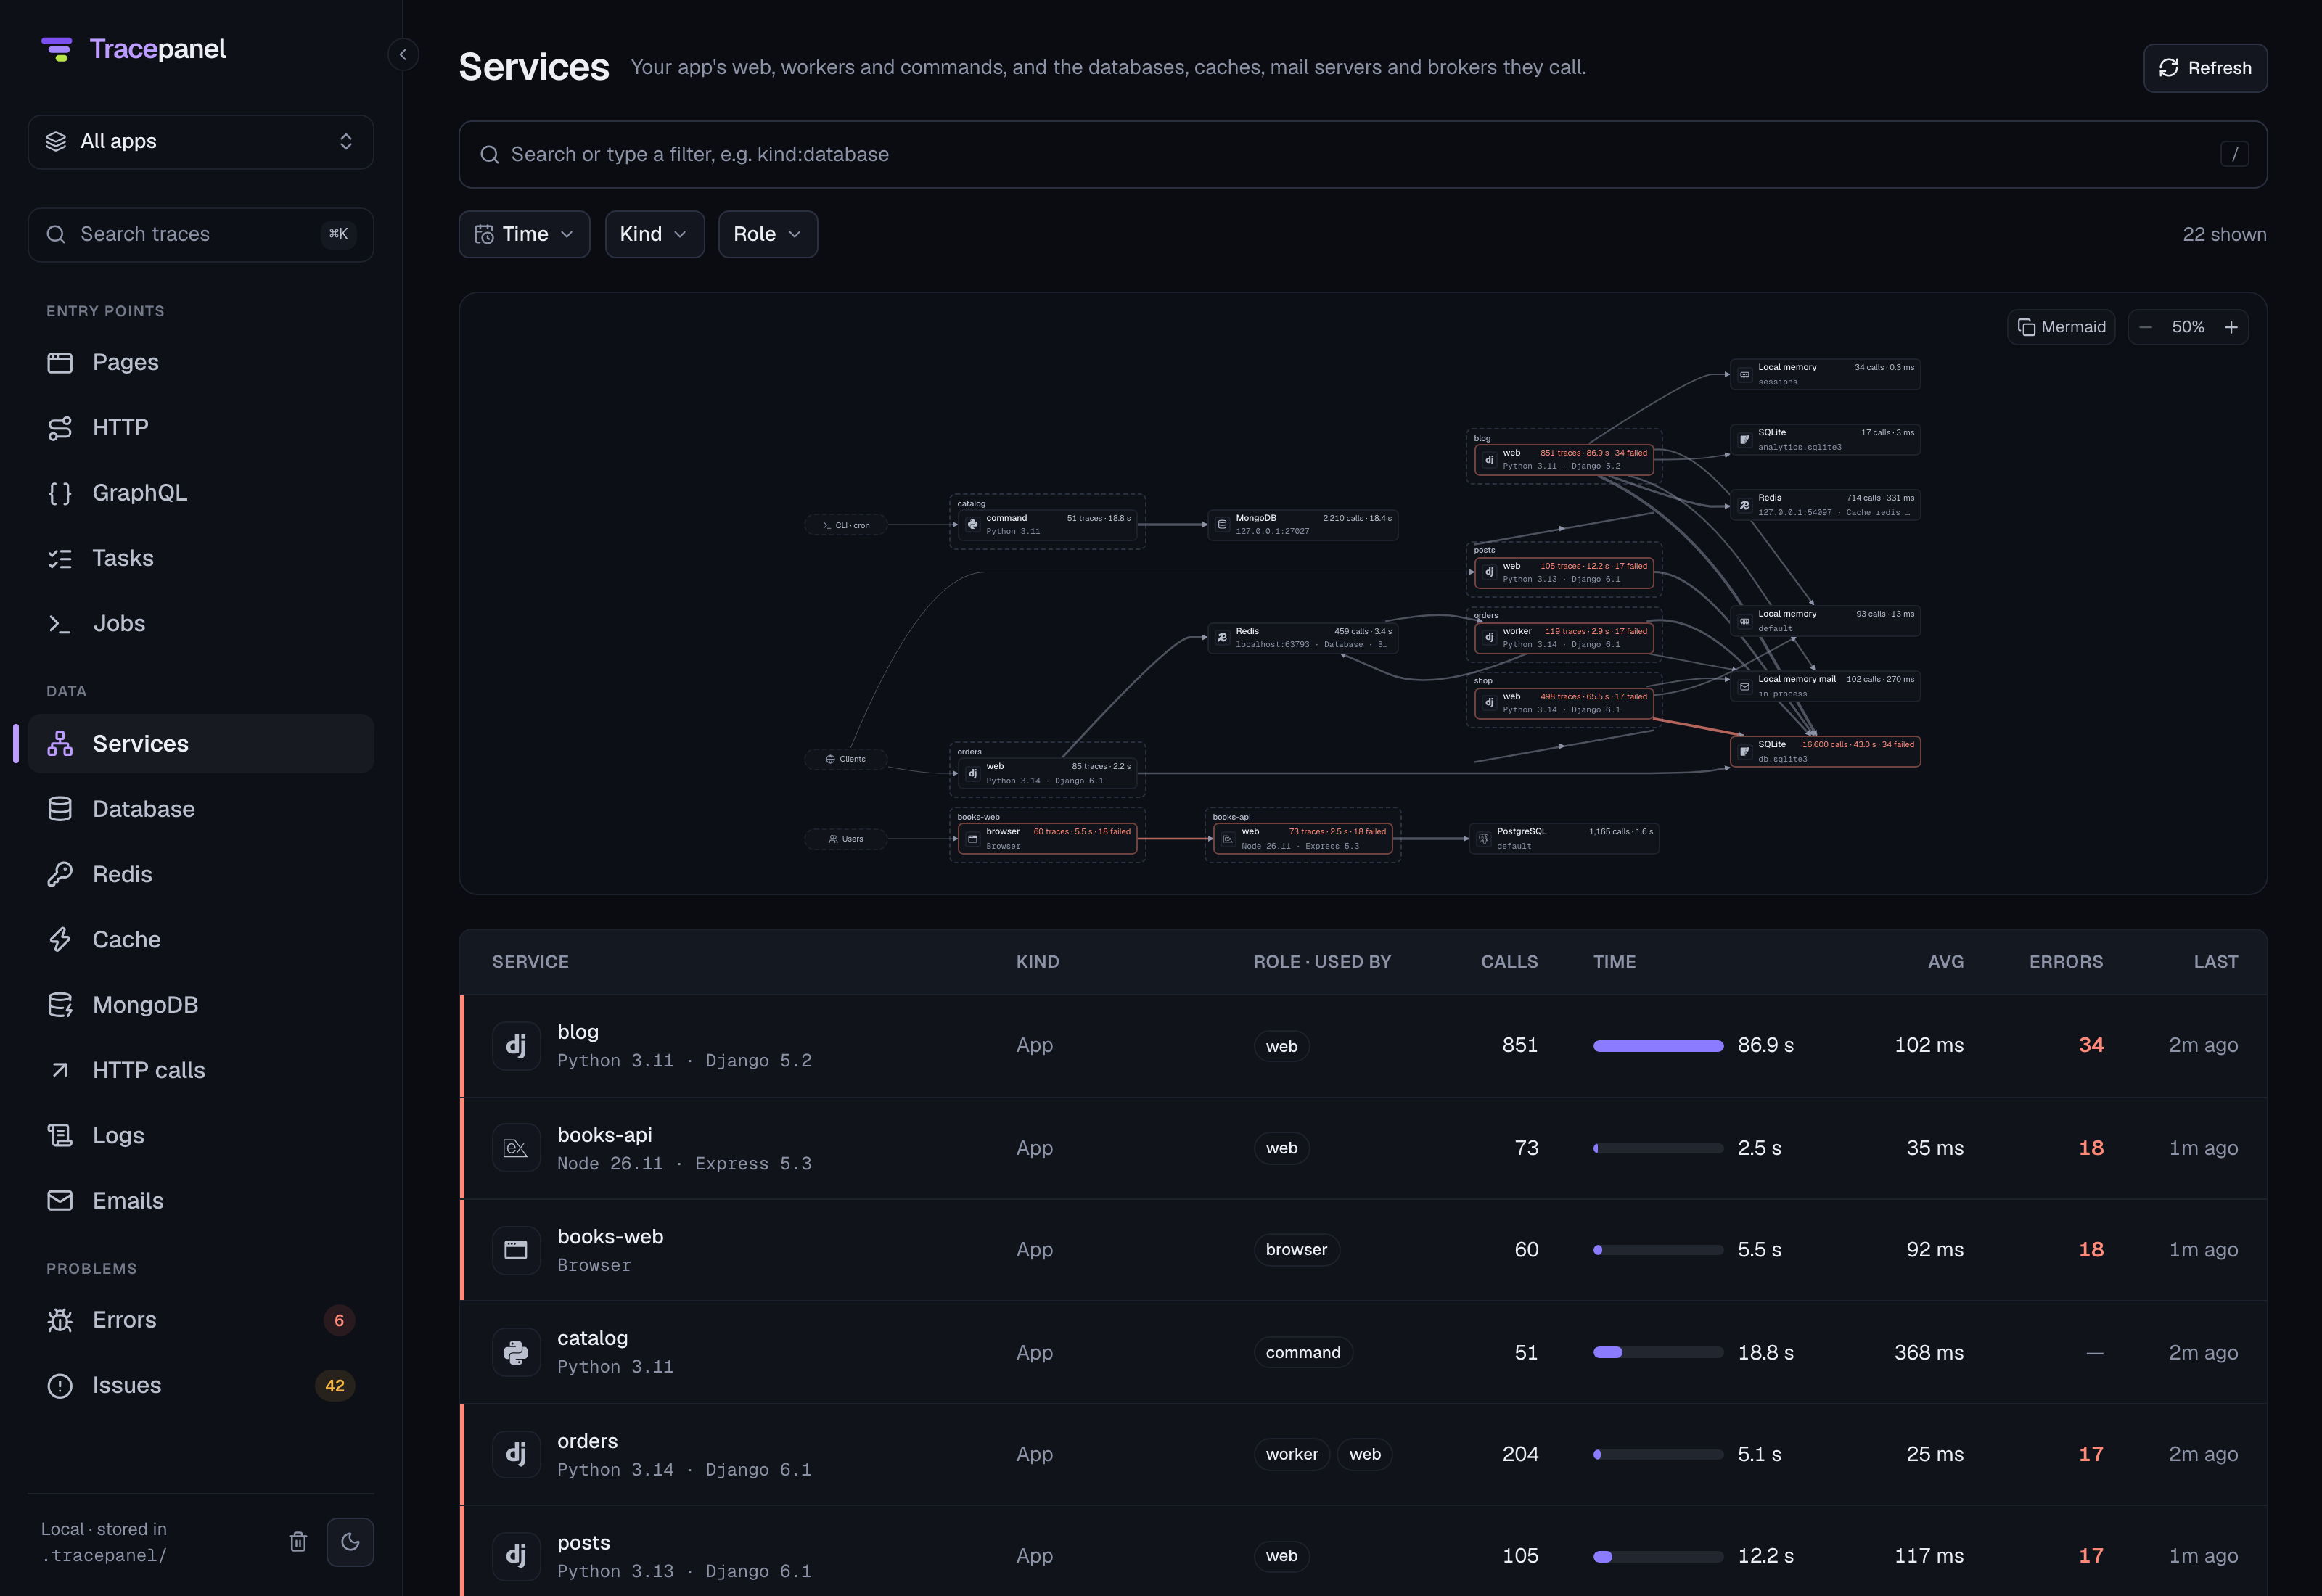
When your app calls another app that Tracepanel or OpenTelemetry traces, the
two traces link. An outgoing HTTP call carries a traceparent header, and a
Django request that comes with one continues that trace. The call tree shows
the other app's trace under the call, and the console's Services page draws
an arrow from app to app.
MongoDB
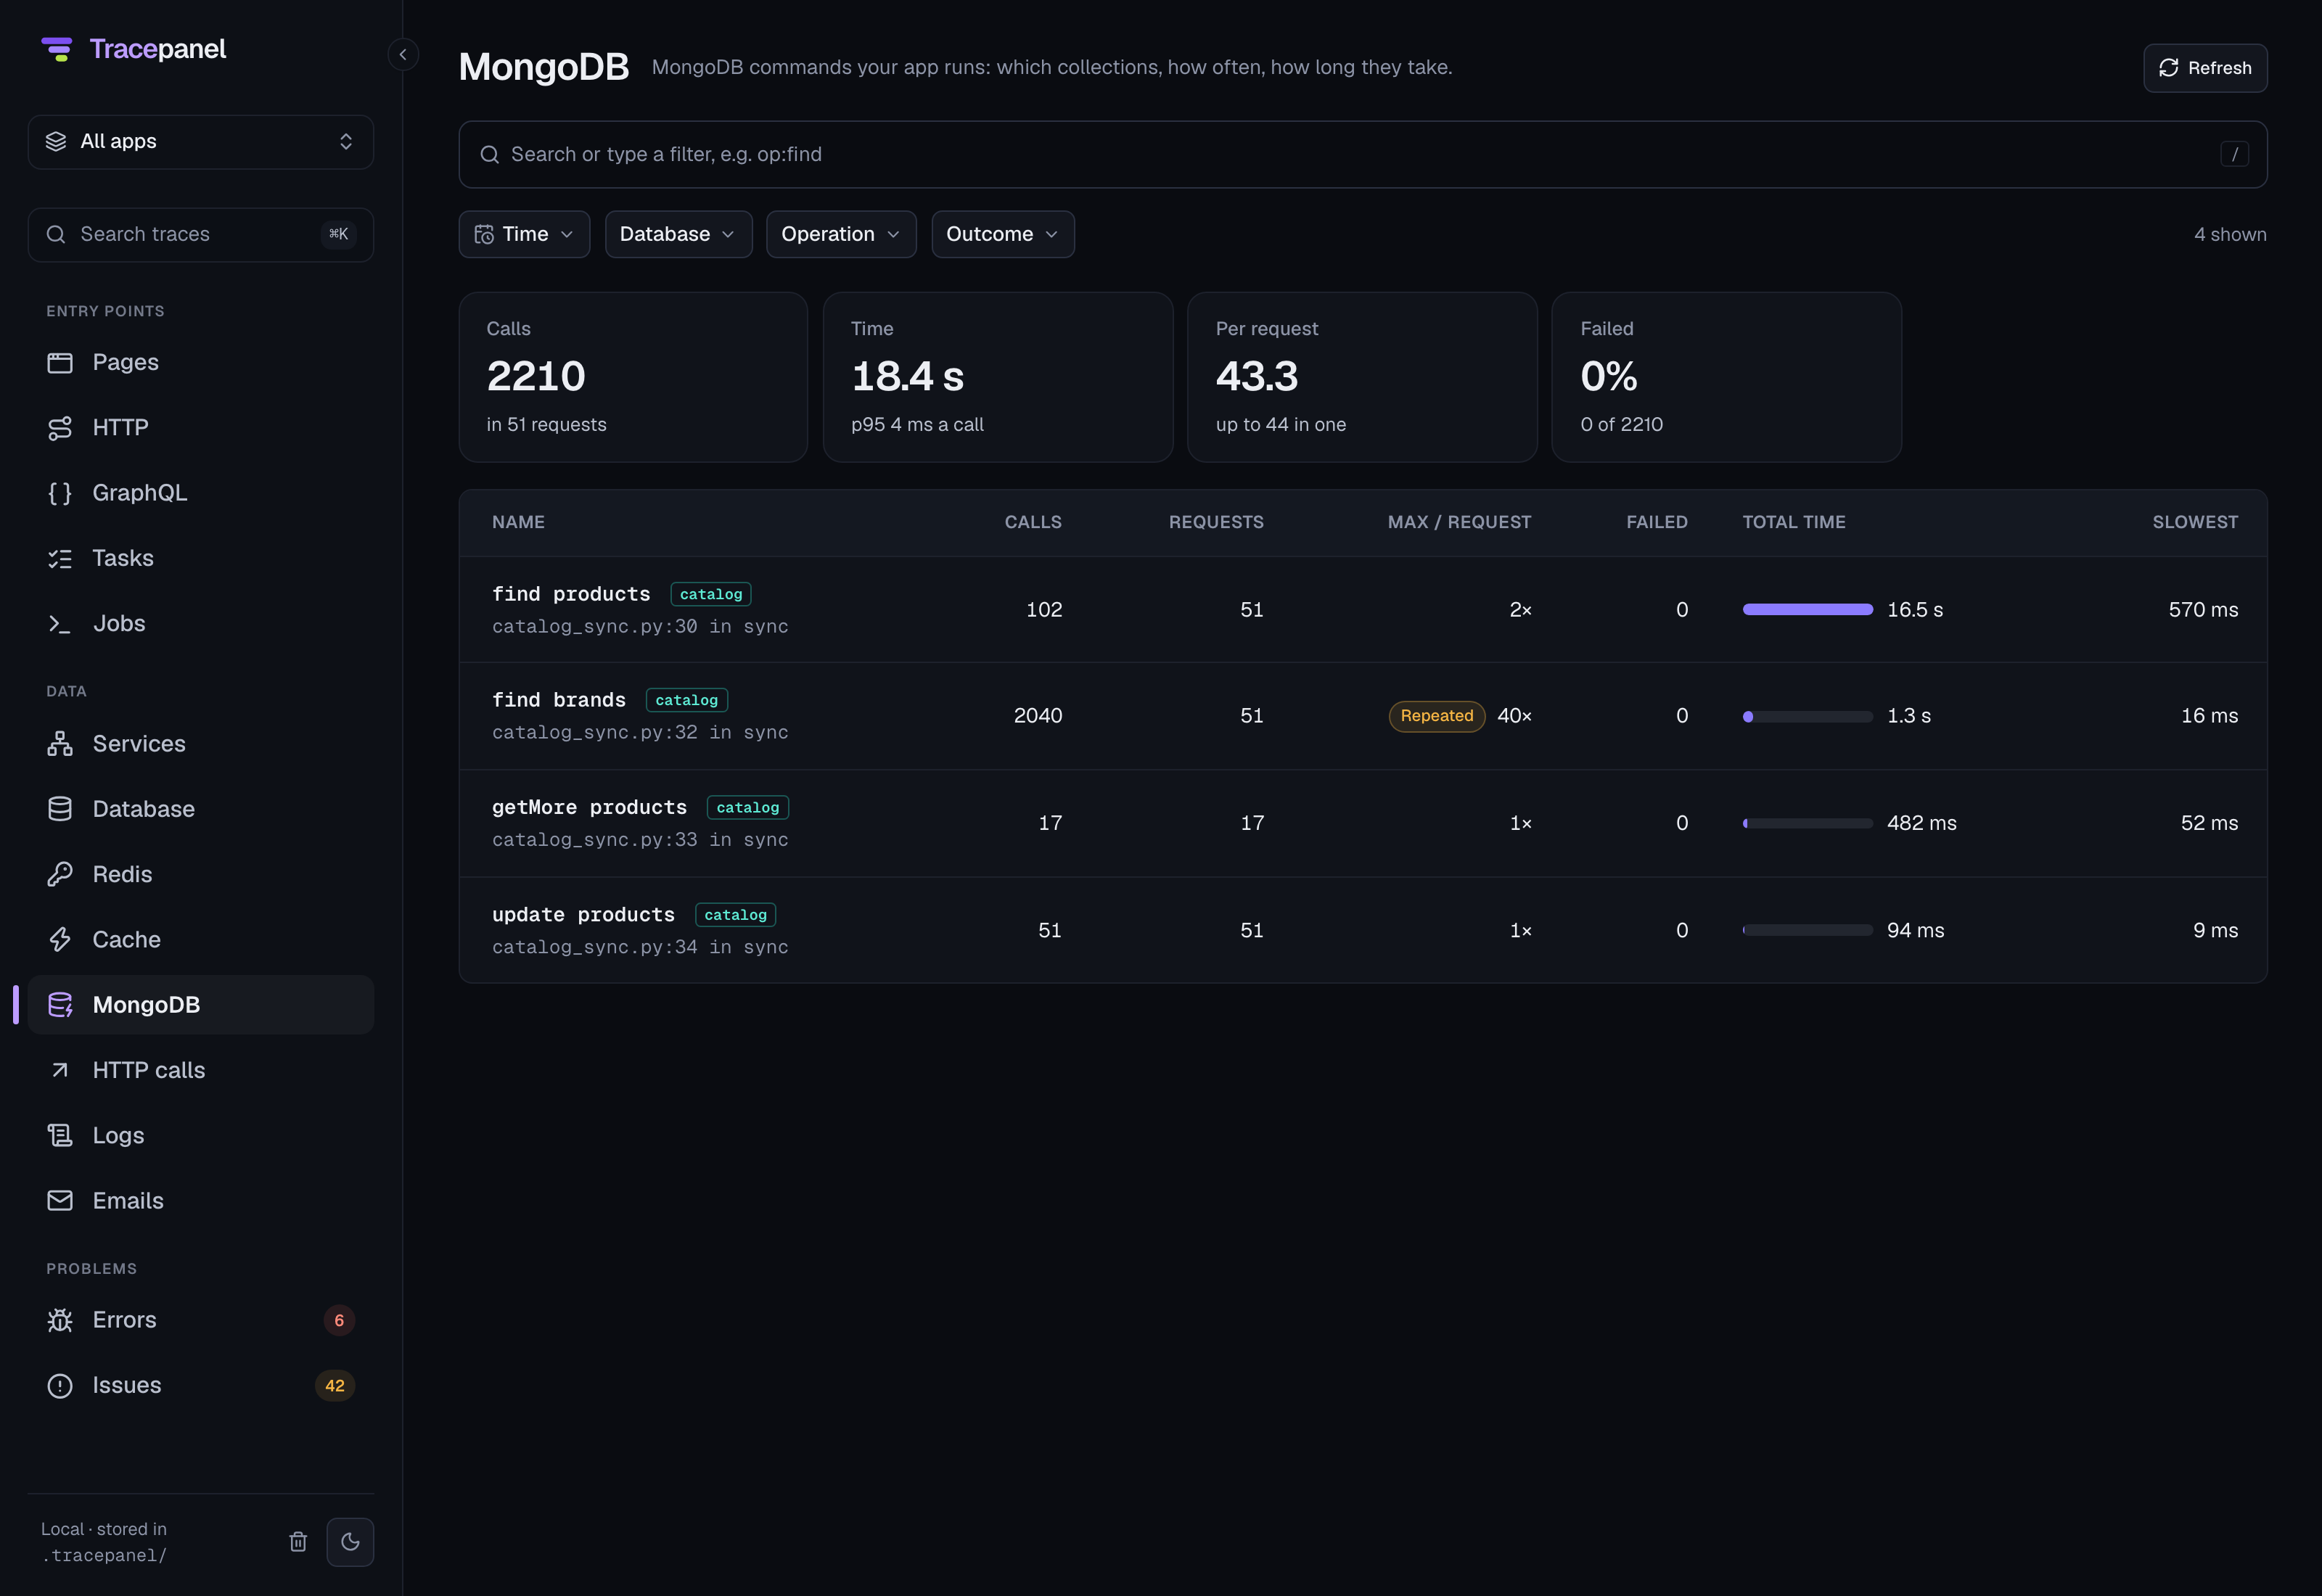
Each pymongo command is a step, from MongoClient, AsyncMongoClient or
Motor. Tracepanel records the clients the app creates after it imports
pymongo. A step shows the command's shape, such as
{"find": "users", "filter": {"email": "?"}}, and keeps its values apart, as
it does SQL parameters.
The agent finds these issues in MongoDB queries:
- N+1 queries. A
findfor each item, with$inor$lookupas the fix. - Duplicate queries. The same
findwith the same values. - Slow calls. A query over
slow_sql_ms. The hint names the index its filter and sort need, as the shell creates it:db.users.createIndex({"email": 1}).
Async views
In an async view, a synchronous call blocks the event loop, and every other
request waits for it. That happens with the sync cache API, such as
cache.get(), an HTTP call through requests, a redis-py command or a
database driver used directly. The ORM itself refuses to run synchronously in
an async view and raises SynchronousOnlyOperation.
Tracepanel marks such calls, and the agent reports them as blocking
calls: one issue for each place in your code, once its calls cost 5 ms
together. The hint names the async API to use instead, such as aget() and
aset() on the cache, httpx.AsyncClient or redis.asyncio. A call that
runs in a thread, through sync_to_async() or asyncio.to_thread(), blocks
nothing and isn't marked.
Management commands
Each management command is a trace of its own, with the same SQL and issues
as a request. The terminal prints a line with a link to it when the command
ends. The ignore_commands setting leaves out the dev server, shells, the
test runner and task workers.
Django libraries
Tracepanel traces these libraries when they are installed:
| Library | Setting | What Tracepanel records |
|---|---|---|
| Django REST framework | drf_enabled | The view named after the ViewSet action, such as PostViewSet.list. Authentication, permissions with the class that refused, throttles, validation with the 400's errors, and serialization as steps. |
| Django Ninja | ninja_enabled | The view named after the operation's function. Authentication, input validation with the 422's errors, and response serialization as steps. |
| Channels | channels_enabled | Each WebSocket event as a trace: the connect, each frame, each channel layer message and the disconnect. Group messages link to the span that sent them. |
| Django Tasks | django_tasks_enabled | Each task run as a trace, linked to the request that queued it. django.tasks on Django 6.0 and later, and the django-tasks backport on Django 5.2. |
| Celery | celery_enabled | Each task run as a trace, linked to the request that queued it, with its time in the queue, retries, failures, arguments and result. |
| Strawberry | strawberry_enabled | GraphQL requests named after the operation, and your resolvers as steps. |
RQ, Dramatiq, SQLAlchemy, the database drivers, the HTTP clients, Redis, MongoDB, htmx and OpenTelemetry work the same as in any Python app. See Integrations.
Tasks and the request that queued them
When a request queues a task, the call tree shows the enqueue as a step. Each
run of the task is a trace of its own that links back to it. A task queued
inside atomic() is reported as work inside a transaction, since the worker
may run it before the data is committed.
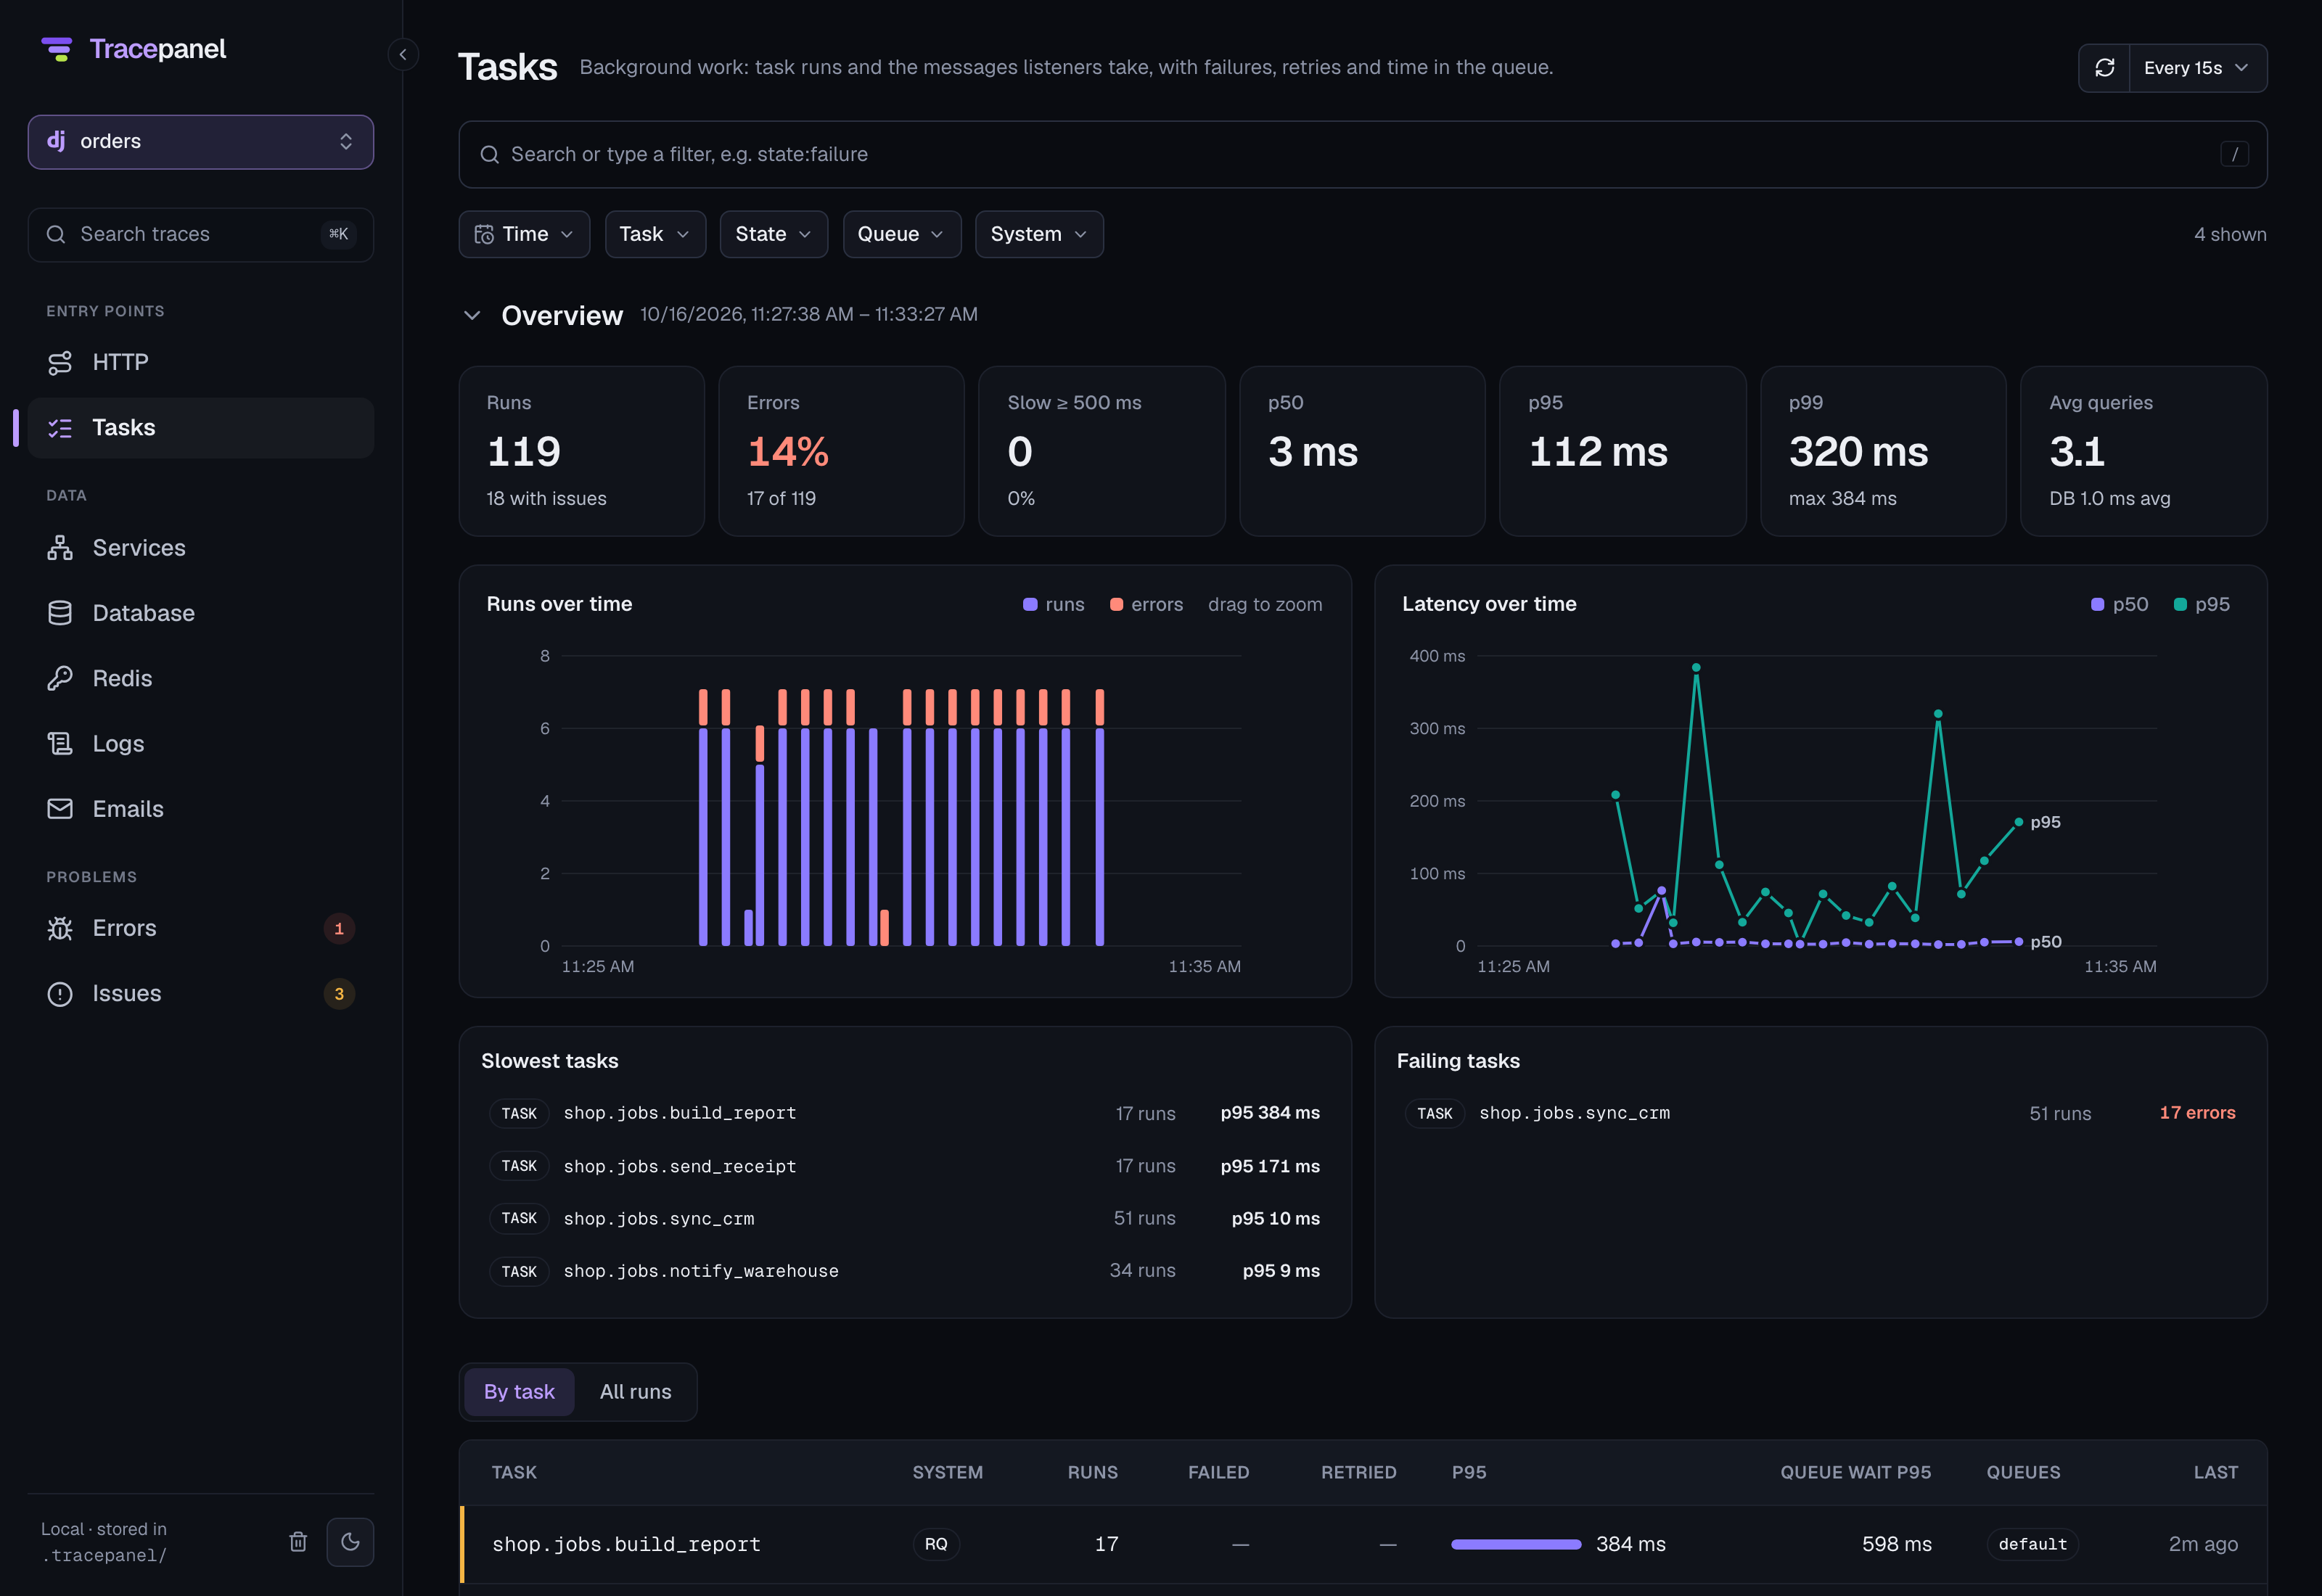
A task that waited in its queue for a second or more is reported as a queue wait: the workers were all busy. Celery, RQ, Dramatiq and Django Tasks record the wait.
Turn a part off
Each library above has an *_enabled setting. Set it to False in the
TRACEPANEL dict, and Tracepanel leaves the library alone:
# settings.py
TRACEPANEL = {"drf_enabled": False}
Tracepanel installs the integrations when Django starts. Restart the server after you change one. See Settings.