Issues
The problems Tracepanel finds in each request, task and command, what triggers each one, and the fix it suggests.
The agent reads every trace as it arrives and reports what is worth fixing. Each issue names the line of your code it comes from, called the culprit, and suggests a fix. For SQL and transactions, the fix uses the API of your ORM when the agent knows it. Today that is Django's ORM and SQLAlchemy. For calls to other systems, the fix uses that system's way to batch or index.
You see issues in several places:
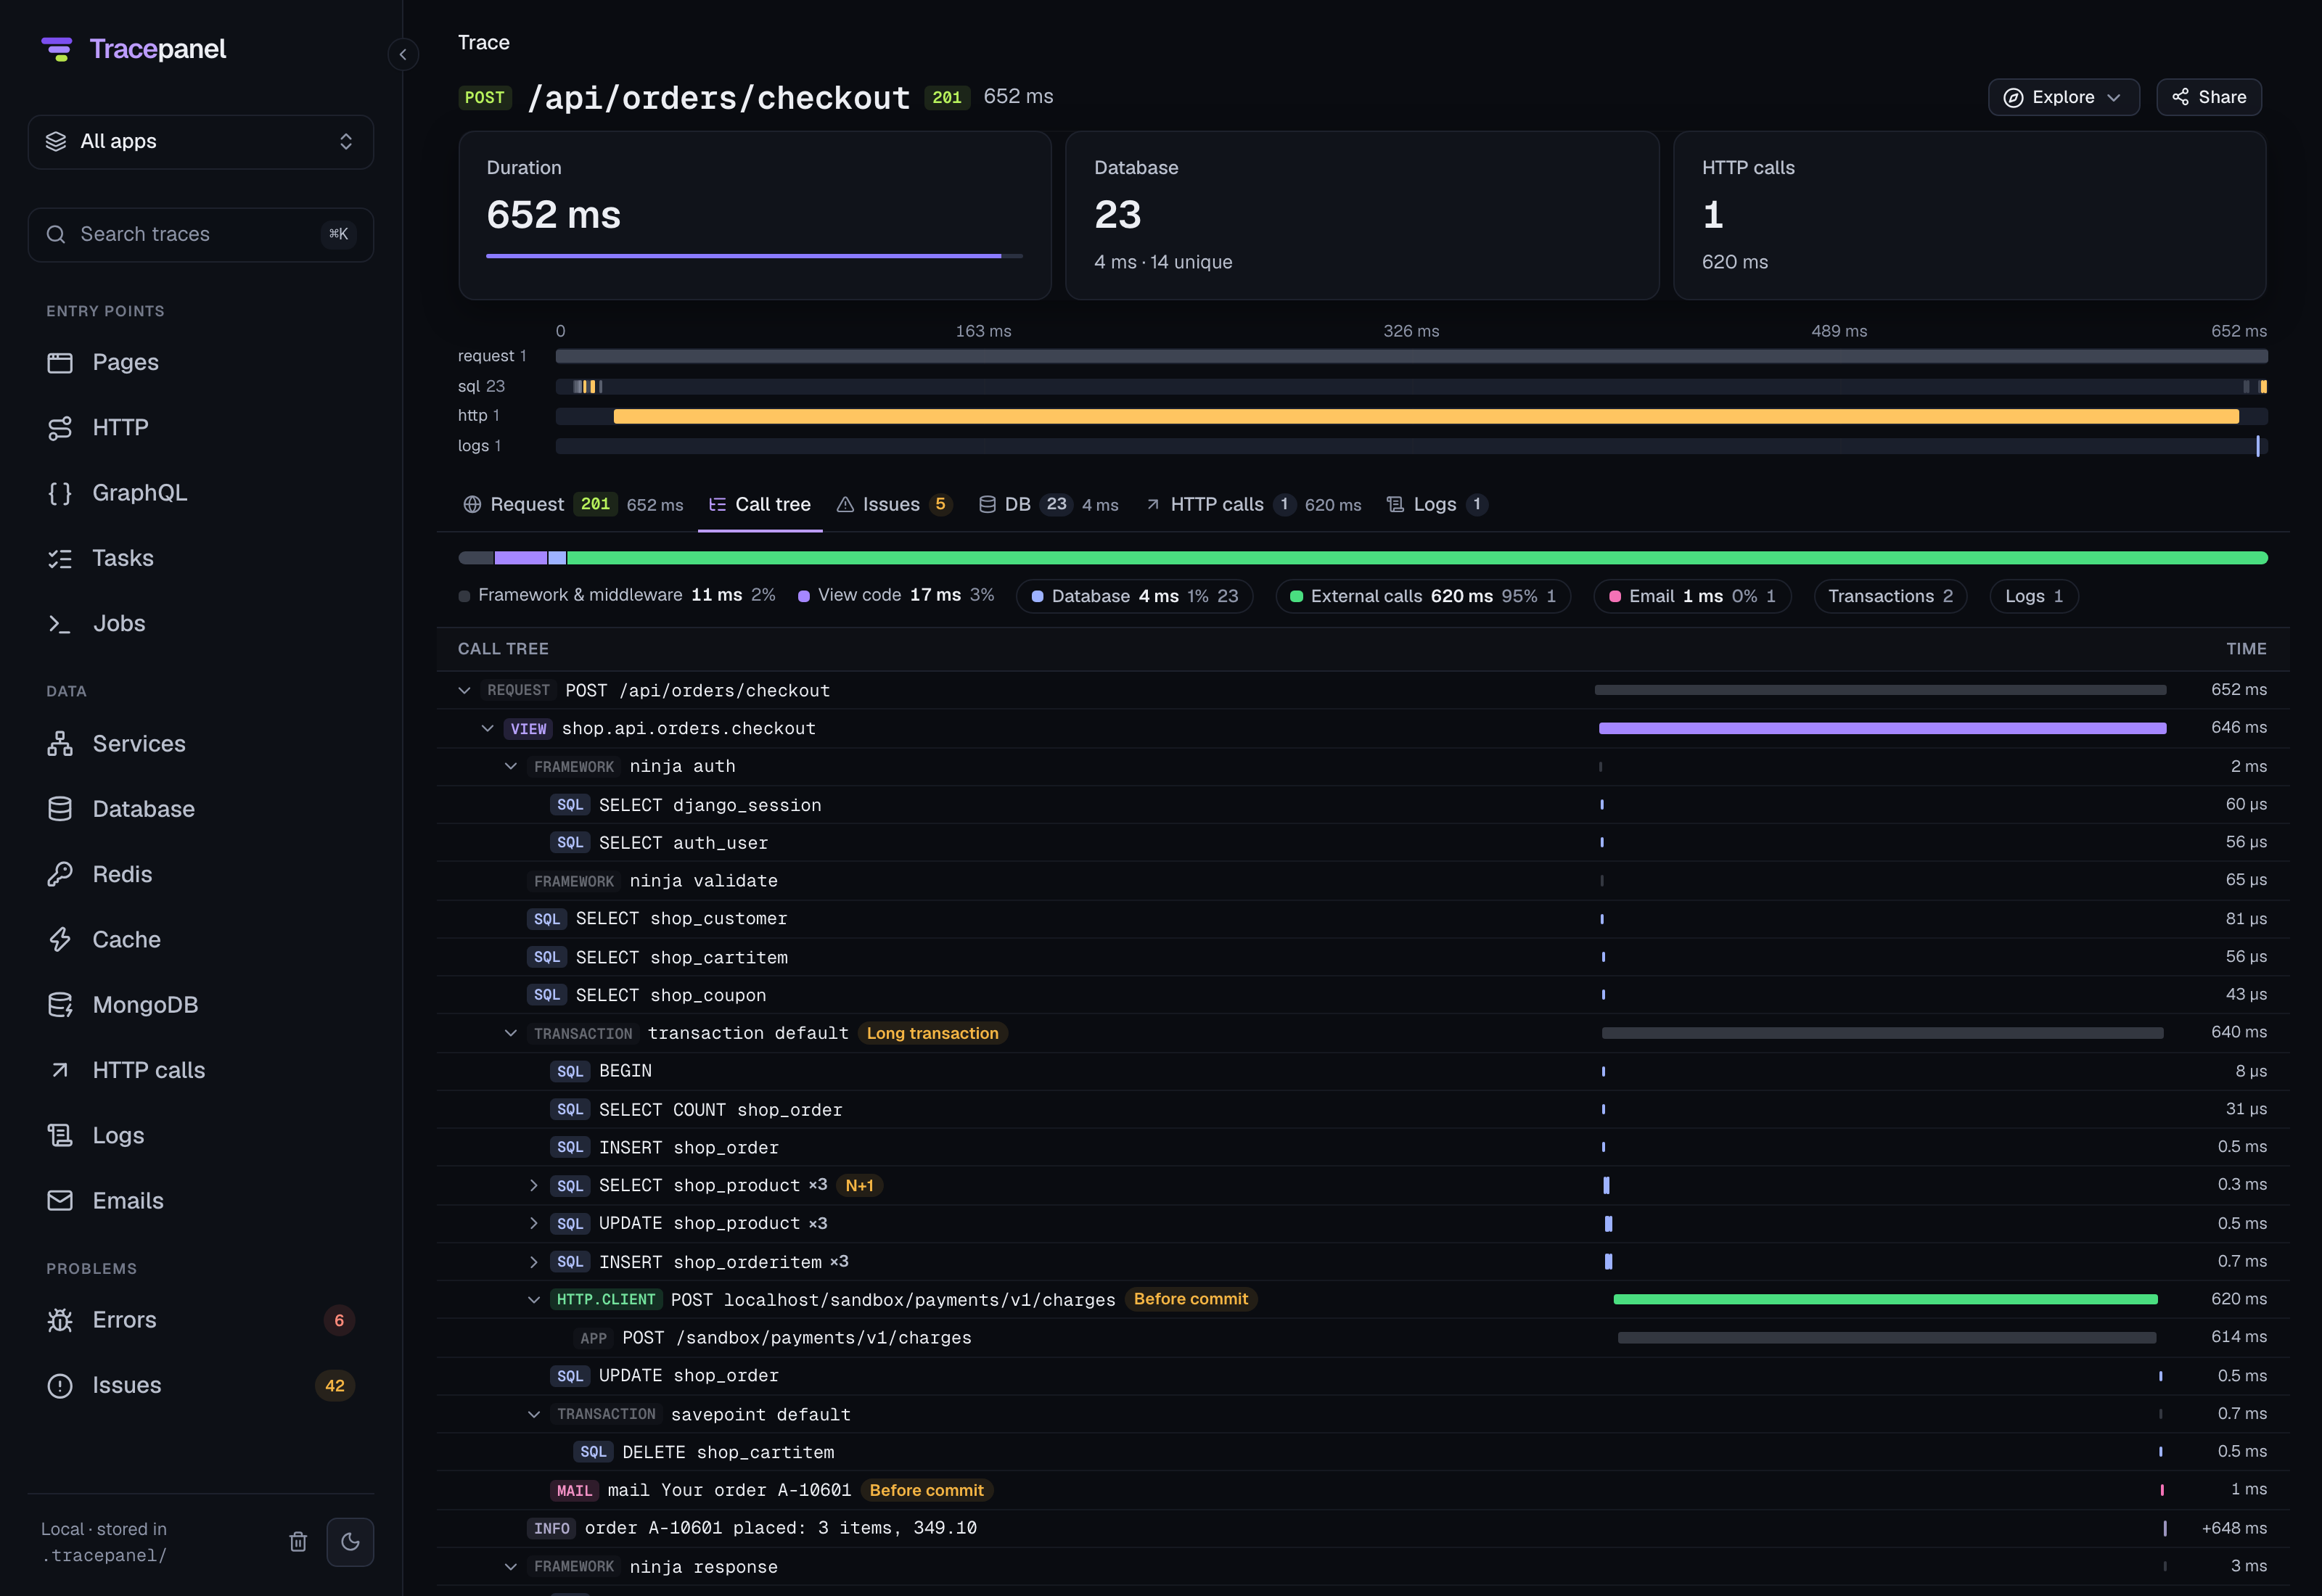
- The badge counts the issues of the request it shows, and its hover card lists the first two.
- The panel's Issues tab lists them for one request. See The panel.
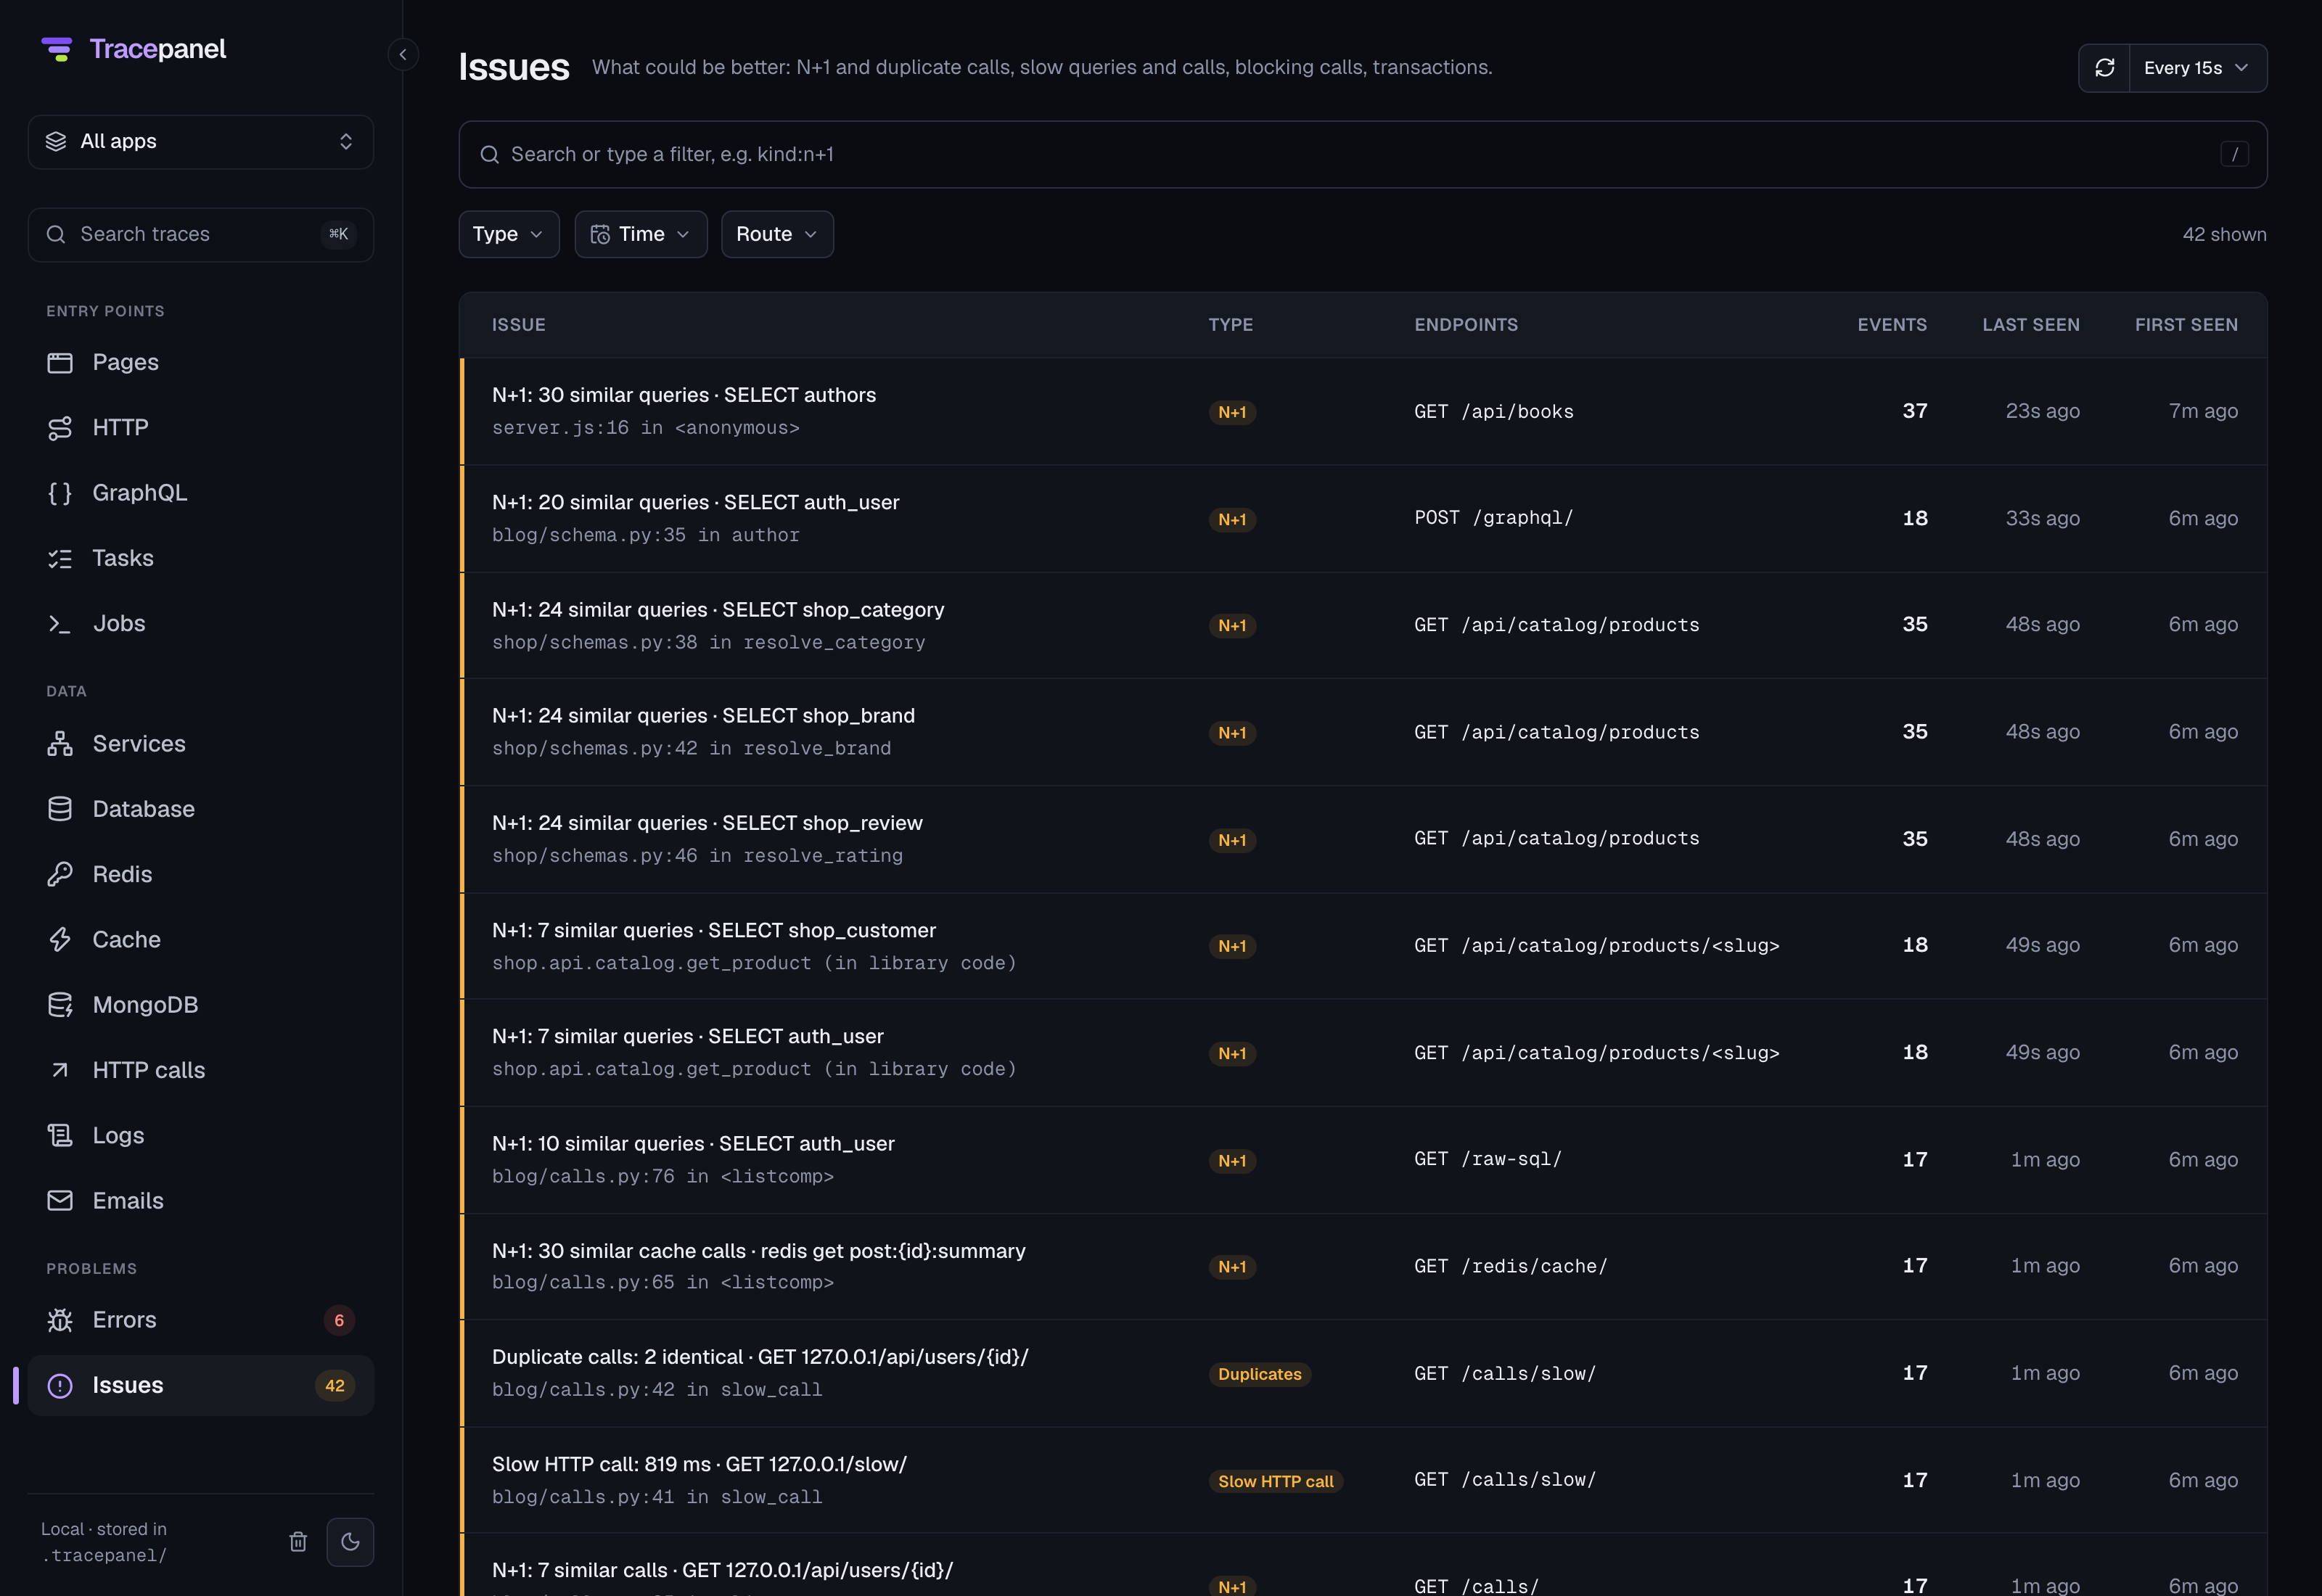
- The console's Issues page groups them across requests, and Errors groups the exceptions. See The console.

An issue keeps the same identity across requests. Tracepanel groups an issue by its kind, its statement, call or exception, and its culprit without the line number, so editing the file above it doesn't split the group.
These are the kinds, with the name that has: and kind: take in a search:
| Issue | Name | Reports |
|---|---|---|
| N+1 queries and calls | n+1 | the same query or call, once per item |
| Duplicates | duplicates | the same read, with the same values, more than once |
| Slow SQL | slow-sql | a query over slow_sql_ms |
| Slow HTTP calls | slow-http | an outgoing HTTP call over slow_http_ms |
| Slow calls | slow-call | a datastore query or an RPC call over its threshold |
| Large results | large-result | a SELECT without a LIMIT that returned many rows |
| Long transactions | long-transaction | a transaction open over long_transaction_ms |
| Work before commit | in-transaction | a task, an email or an HTTP call inside a transaction |
| Blocking calls | blocking-call | a synchronous call on an event loop's thread |
| Queue waits | queue-wait | a task that waited for a free worker |
| htmx mistakes | htmx | a redirect or a whole page in an htmx answer |
| Errors | error | an unhandled exception |
N+1 queries and calls
An N+1 is the same query, run once per row of an earlier result. For example, in Python with Django:
for order in Order.objects.all():
    print(order.customer.name)  # one SELECT per order
Similar queries are the same statement with different parameters. Tracepanel
reports an N+1 when similar SELECT queries run with at least
n_plus_one_threshold different sets of parameters. The default is 3. It also
reports a lookup by primary key that runs at least that many times from the
same line.
Tracepanel reports an N+1 only when your code triggers it. If a library ran a loop of lookups by primary key on its own, Tracepanel names the view as the culprit, for example a nested serializer that reads a related object for every row.
The fix is to load the related rows with the parent rows, in a join or in one batched query. For an ORM it knows, Tracepanel names the loader to add to the query that produced the rows. Here is an example of the fix in each ORM:
- For a lookup by primary key,
select_related()loads a ForeignKey in the same query. - For other relations,
prefetch_related()loads a reverse or many-to-many relation in one extra query.
Tracepanel suggests adding the loader to the queryset that produced the rows.
In a GraphQL request, a resolver runs once per object. The hint then also
suggests batching the lookups with a DataLoader, or prefetching in the parent
resolver. In Python with Strawberry, that is strawberry.dataloader.

Calls to other systems
Calls to other systems get the same check. Tracepanel groups the calls of one
system by what they repeat, and reports an N+1 when a group has at least
n_plus_one_threshold different calls from your code:
- HTTP calls to one endpoint, such as
GET api.example.com/users/{id}. - Redis commands and cache calls on one key pattern, such as
user:{id}. - Queries to a datastore, such as MongoDB, on one collection or table.
- RPC calls to one method, such as a gRPC method.
- Messages published to one topic or queue, once per item.
Redis, the cache and Memcached answer from memory in a fraction of a
millisecond. Their repeats are an issue only when they cost
n_plus_one_min_ms together, by their median call. The default is 5 ms.
A cache on Redis sends Redis commands for each cache call. Tracepanel reports the repeats on the cache calls, where you fix them, and not again on their Redis commands.
The fix is to ask for the items in one call. The hint names the system's way to do it:
| System | Fix |
|---|---|
| HTTP | One batch request, or call once and reuse the answer. |
| Redis, cache, Memcached | One multi-key command such as MGET, or a pipeline. |
| MongoDB | An $in filter, such as {"_id": {"$in": ids}}, or a $lookup in an aggregation. |
| Elasticsearch, OpenSearch | _mget for ids, _msearch for searches. |
| DynamoDB | BatchGetItem to read, up to 100 keys, and BatchWriteItem to write. |
| Cassandra | One query with IN on the partition key, or the statements run concurrently. |
| Kafka | Send in the loop and flush once after it. |
| RabbitMQ | Publish in the loop, then wait for the confirms once. |
| SQS | SendMessageBatch, up to 10 messages at a time. |
| Other datastores | One query with an $in filter, a multi-get or a batch. |
| Other RPC systems | A batch or streaming method. |
Duplicates
Tracepanel reports a SELECT that runs two or more times in one trace with
the same parameters. Run the query once and reuse the result, or cache it for
the request.
The same goes for reads from other systems: an HTTP GET to the same URL, a
Redis or cache read of the same key, the same datastore query with the same
values, or the same RPC call. Writes don't count, because two writes are two
actions.
A statement or call that already counts as an N+1 isn't reported as a duplicate too.
Slow SQL
Tracepanel reports a query that takes slow_sql_ms or longer. The default is
100 ms. The fix is to check the query plan and add an index or narrow the
query. Explain on the query in the Database tab runs EXPLAIN and shows
the plan.
When the query's LIKE pattern starts with %, as Django's contains and
icontains make it, the hint says why: no index on the column helps, so the
database reads every row. Match the start of the value instead, or index the
column for searching, with a trigram index such as PostgreSQL's pg_trgm or
with full-text search.
Slow HTTP calls
Tracepanel reports an outgoing HTTP call that takes slow_http_ms or longer.
The default is 500 ms. The request waits for the other service. Set a timeout,
cache the answer, or make the call outside the request, in a background task.
Slow calls
Tracepanel reports a query to a datastore, such as MongoDB, Elasticsearch,
DynamoDB or Cassandra, that takes slow_sql_ms or longer, as it does for SQL.
Memcached answers from memory, so Tracepanel doesn't check it. It also reports
an RPC call, such as a gRPC call, that takes slow_http_ms or longer.
For a slow MongoDB query, the hint names the index that its filter and sort need, as the MongoDB shell creates it:
db.users.createIndex({"email": 1})Without such an index, MongoDB reads every document of the collection, which
explain() shows as COLLSCAN.
For other datastores, the fix is an index on the fields the query filters or sorts by, or a narrower query. For an RPC call, set a deadline, cache the answer, or make the call outside the request.
Large results
Tracepanel reports a SELECT without a LIMIT that returned 1000 rows or
more. Every row was fetched and, through an ORM, made into an object. Paginate
the query, fetch only what the page shows, or, for batch work, stream the rows
and take only the columns you use. In Django, that is Paginator,
.iterator() and .values_list().
Long transactions
Tracepanel reports an outer transaction that stays open for
long_transaction_ms or longer. The default is 500 ms. Savepoints inside it
don't count on their own.
The rows a transaction locks stay locked until COMMIT. The fix is to keep
slow work out of the transaction, such as HTTP calls, emails and heavy
computation. Here is an example of the fix in each ORM:
Move the slow work out of the atomic() block.
Work before commit
Some work inside a transaction should wait for the commit. The console labels these issues Before commit.
| Inside a transaction | Why it matters |
|---|---|
| Queueing a task | A worker can pick the task up before COMMIT and not see the data, or run it after a rollback. |
| Sending an email | The email goes out even if the transaction rolls back. |
| An HTTP call | The transaction holds its locks while the other service answers. |
The fix is to do the work after the commit. Here is an example of the fix in each ORM:
| Inside a transaction | Fix |
|---|---|
| Queueing a task | transaction.on_commit(lambda: task.delay(...)) |
| Sending an email | transaction.on_commit(...) |
| An HTTP call | Make the call before atomic() or in transaction.on_commit(...). |
Callbacks registered with on_commit() run after the commit, and Tracepanel
doesn't count the work inside them.
Tasks that run eagerly in the same process don't count.
Blocking calls
In async code, an event loop serves many requests on one thread. A synchronous call on that thread, such as SQL through a sync driver, makes every other request on the loop wait. The SDK marks such calls, and Tracepanel reports SQL, HTTP calls, Redis commands and cache calls made this way. It reports one issue per place in your code, once its calls take 5 ms together.
The hint names what to use instead:
| Call | Fix in Python |
|---|---|
| SQL | Django's async ORM, such as aget(), afirst() and async for, or sync_to_async. Elsewhere, an async driver such as asyncpg, psycopg's AsyncConnection or aiosqlite. |
| HTTP | An async client, such as httpx.AsyncClient or aiohttp. |
| Redis | The redis.asyncio client. |
| Cache | The cache's async API, such as aget() and aset(). |
| Other calls | An async client, or the call in a thread with asyncio.to_thread or sync_to_async. |
A sync call in a thread, or in a sync view, doesn't block the loop and isn't reported.
Queue waits
Tracepanel reports a task that waited in its queue for more than 1 second before a worker took it. The workers were all busy, so every task behind it waited too. Run more workers, or give slow tasks a queue of their own so quick ones don't wait behind them.
htmx mistakes
Two answers to an htmx request show up only as a broken page. Tracepanel reports both:
- A redirect. The browser follows a redirect inside htmx's request, and
htmx swaps the page it lands on into the target. Answer an htmx request with
an
HX-RedirectorHX-Locationheader to move the browser, or with a 4xx status that the page shows. - A whole page in a fragment. htmx swaps the response into its target
element, so a whole page ends up nested in the current one. Render a
fragment when the
HX-Requestheader is set, or let the link load the page withhx-boost.
A boosted request and a history restore expect a whole page, so Tracepanel doesn't report them.
Errors
Tracepanel reports every unhandled exception with its stack and the local variables of your code. The culprit is the deepest frame in your project. The Error tab opens that frame and folds consecutive library frames into one group.
Tracepanel groups the same exception type raised from the same function into one error across requests, with a count. The console lists errors on their own page, Errors, apart from the other issues.
Tracepanel masks local variables whose names look secret, such as passwords,
tokens and keys. In the Python SDK, the capture_locals setting turns local
variables off.
Tuning the thresholds
Five settings of the Python SDK control when Tracepanel reports an issue:
| Setting | Default | Reports |
|---|---|---|
n_plus_one_threshold | 3 | similar queries or calls with this many different values as an N+1 |
n_plus_one_min_ms | 5 | repeats of Redis, the cache or Memcached only when they take this long together |
slow_sql_ms | 100 | a SQL or datastore query this slow or slower |
slow_http_ms | 500 | an outgoing HTTP call or an RPC call this slow or slower |
long_transaction_ms | 500 | an outer transaction open this long or longer |
For example, set them in pyproject.toml:
[tool.tracepanel]
n_plus_one_threshold = 5
slow_sql_ms = 200
See Configuration for the other places a Python setting can come from.
The other thresholds are fixed, and the Python SDK has no setting for them. A queue wait counts from 1 second, and a large result from 1000 rows. A blocking call counts once the calls from one place take 5 ms together.