Tracepanel
A local debug toolbar that records every request, task and command of your app with its SQL, calls, logs and errors.
Tracepanel shows what your app does on every request. An SDK inside your app records each request, background task and command with its SQL queries, its calls to Redis, caches, HTTP APIs and other services, its templates, log lines and errors. It sends each trace to a local agent. The agent finds N+1 queries and calls, duplicate and slow SQL, slow HTTP and datastore calls, large results, blocking calls in async code, long transactions, work inside a transaction, queue waits, htmx mistakes and errors. Each issue names the line of your code that caused it.
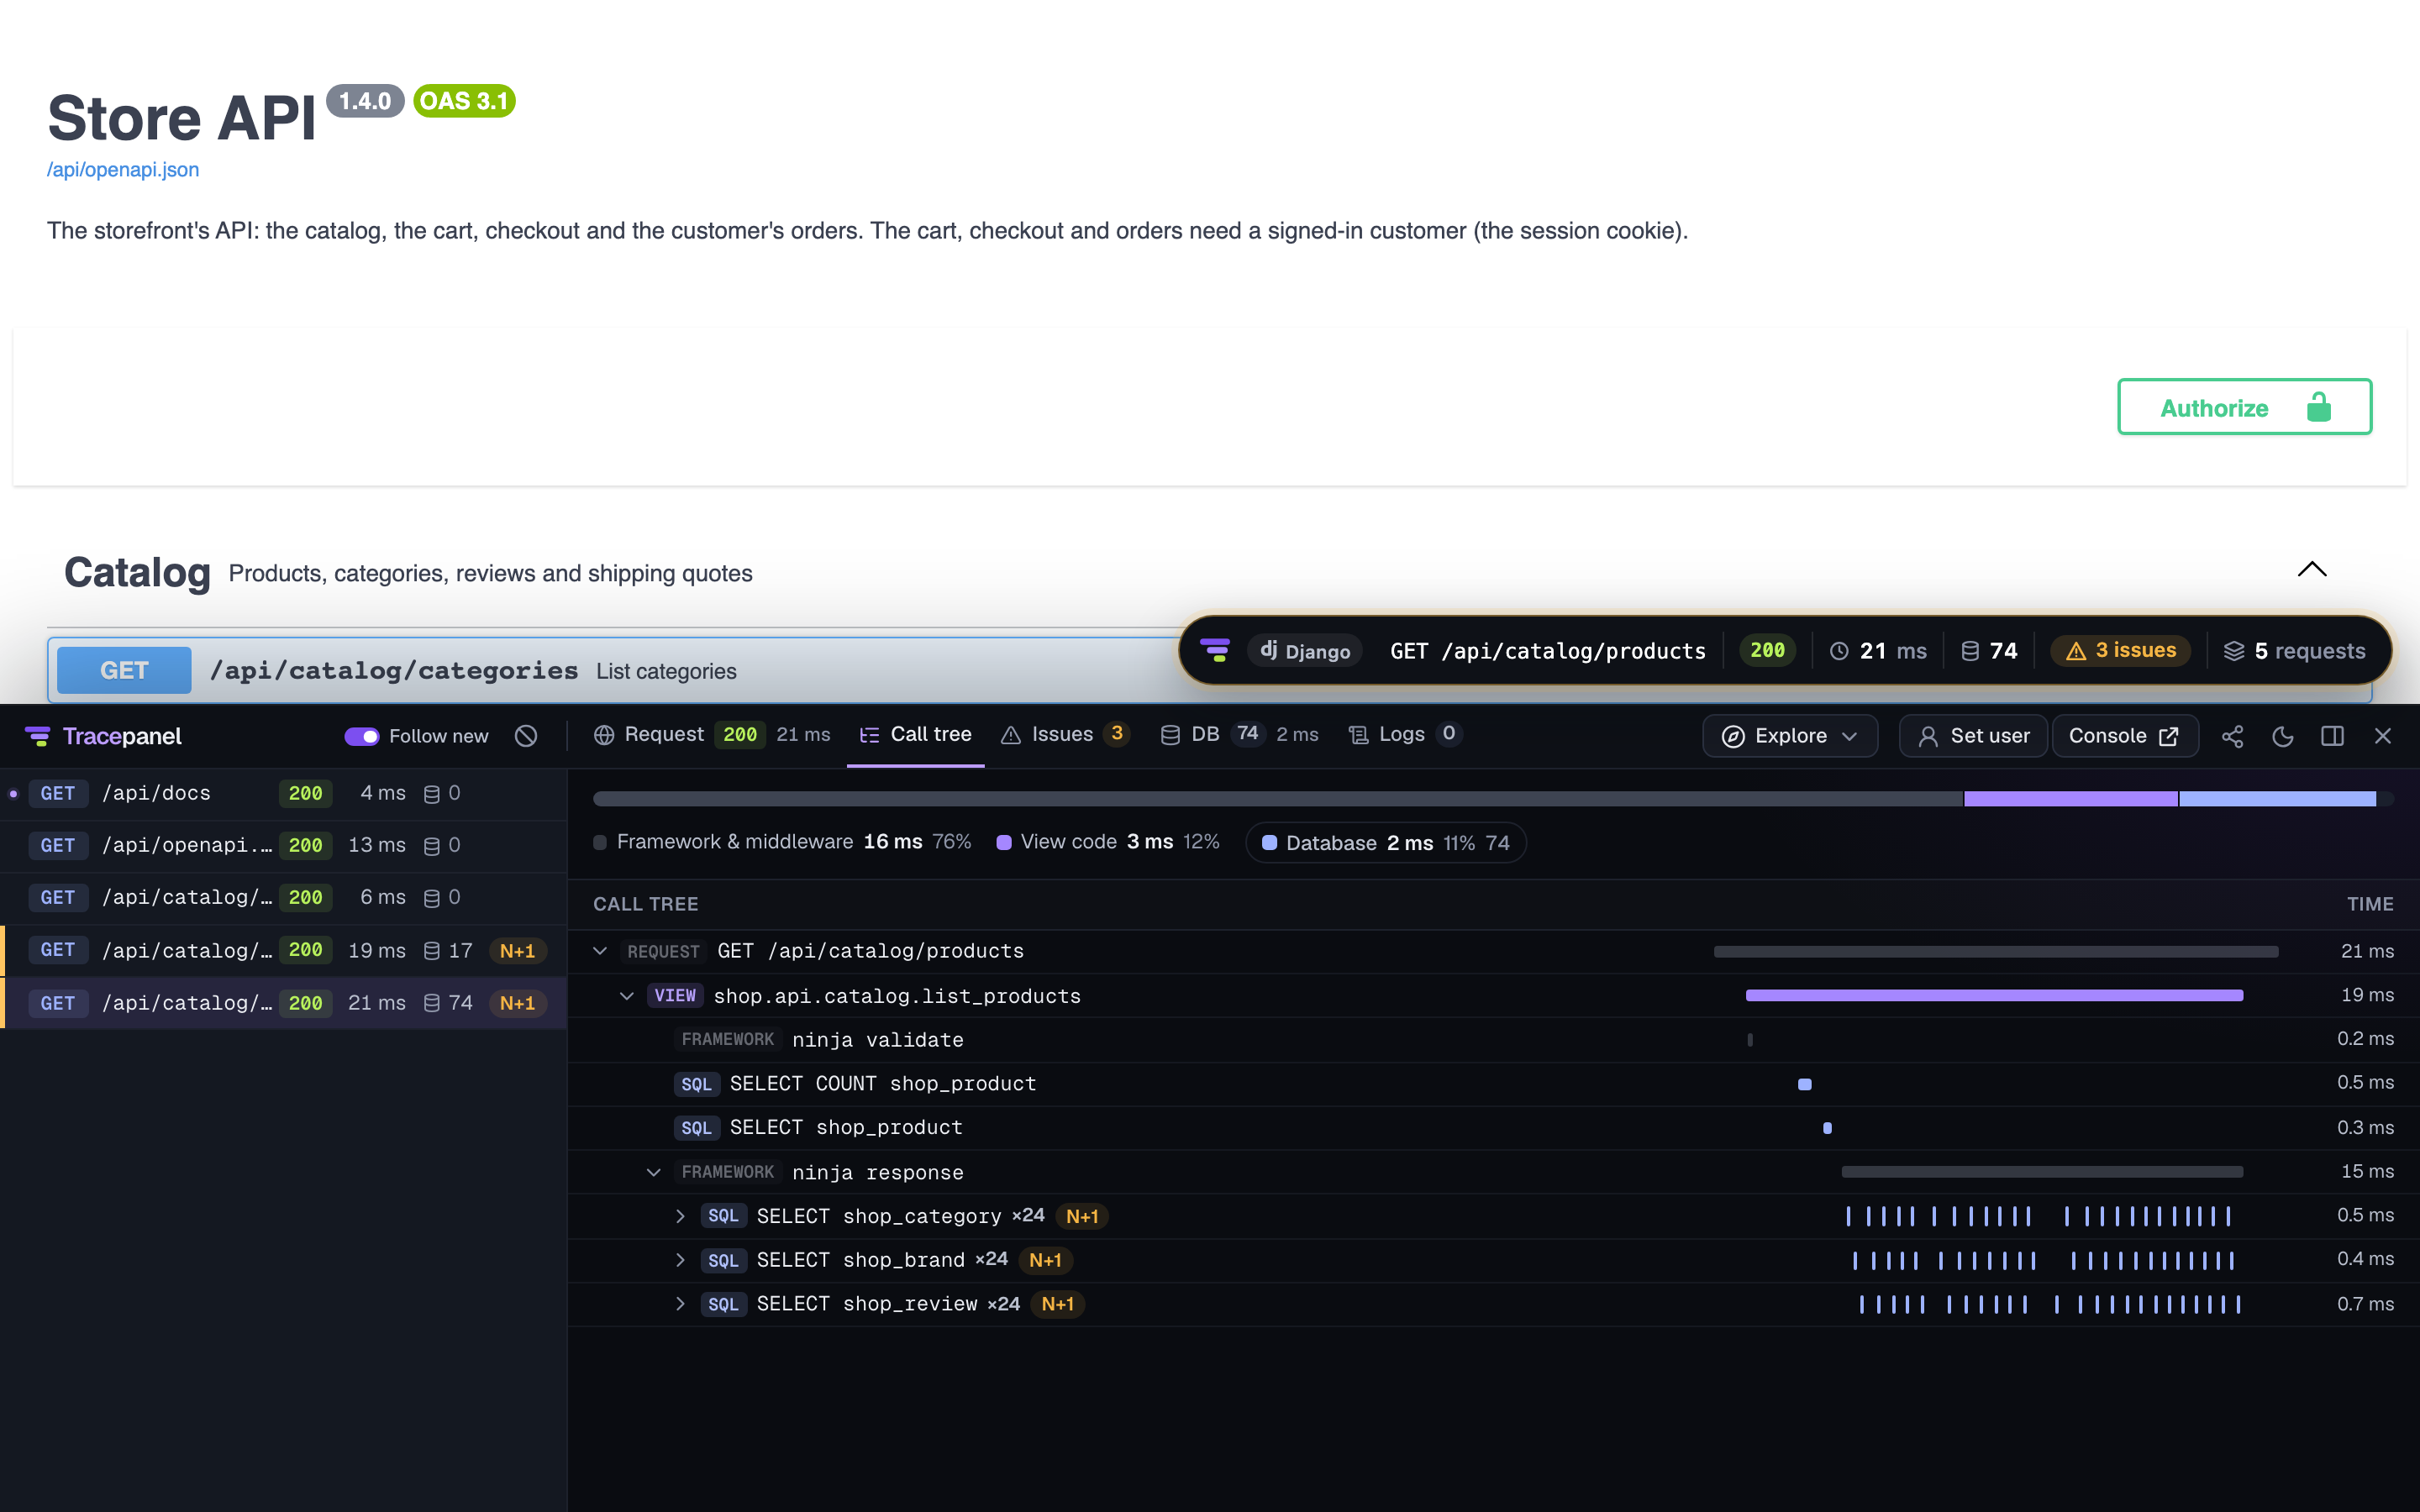
You read the traces in two places. A badge in the corner of each page opens
the panel, which lists every request the page made with its call tree, SQL and
logs. The console at /__tracepanel__/ lists every request, task and command
the app ran, and every system it called.
Tracepanel runs only in development. Your traces stay in .tracepanel/ in
your project, and nothing leaves your machine.
Get started
Tracepanel has SDKs for Python and for JavaScript. The Python SDK supports Django, FastAPI and Flask, and also Starlette and Falcon. The JavaScript SDK supports Express, NestJS, Next.js, Nuxt and Bun, and records the pages of a single-page app in the browser. A service in another language shows in the console through OpenTelemetry, with no Tracepanel SDK. See How it works.
Python
Install the package and add it to your app.
Django
Tracepanel in a Django project: the ORM, transactions, templates, DRF, Celery and more.
JavaScript
Install the package and add it to your Express, NestJS, Next.js, Nuxt or Bun app.
Pages in the browser
The panel in a single-page app on Vite, and what users do on its pages.
Learn the concepts
Versions
The agent and the SDKs are released together, at one version. The current
version is 0.2.0, released on 2026-10-14. pip install tracepanel and npm install @tracepanel/js install the agent of the same version with them.
Each repository's changelog lists what changed in each version: