The panel
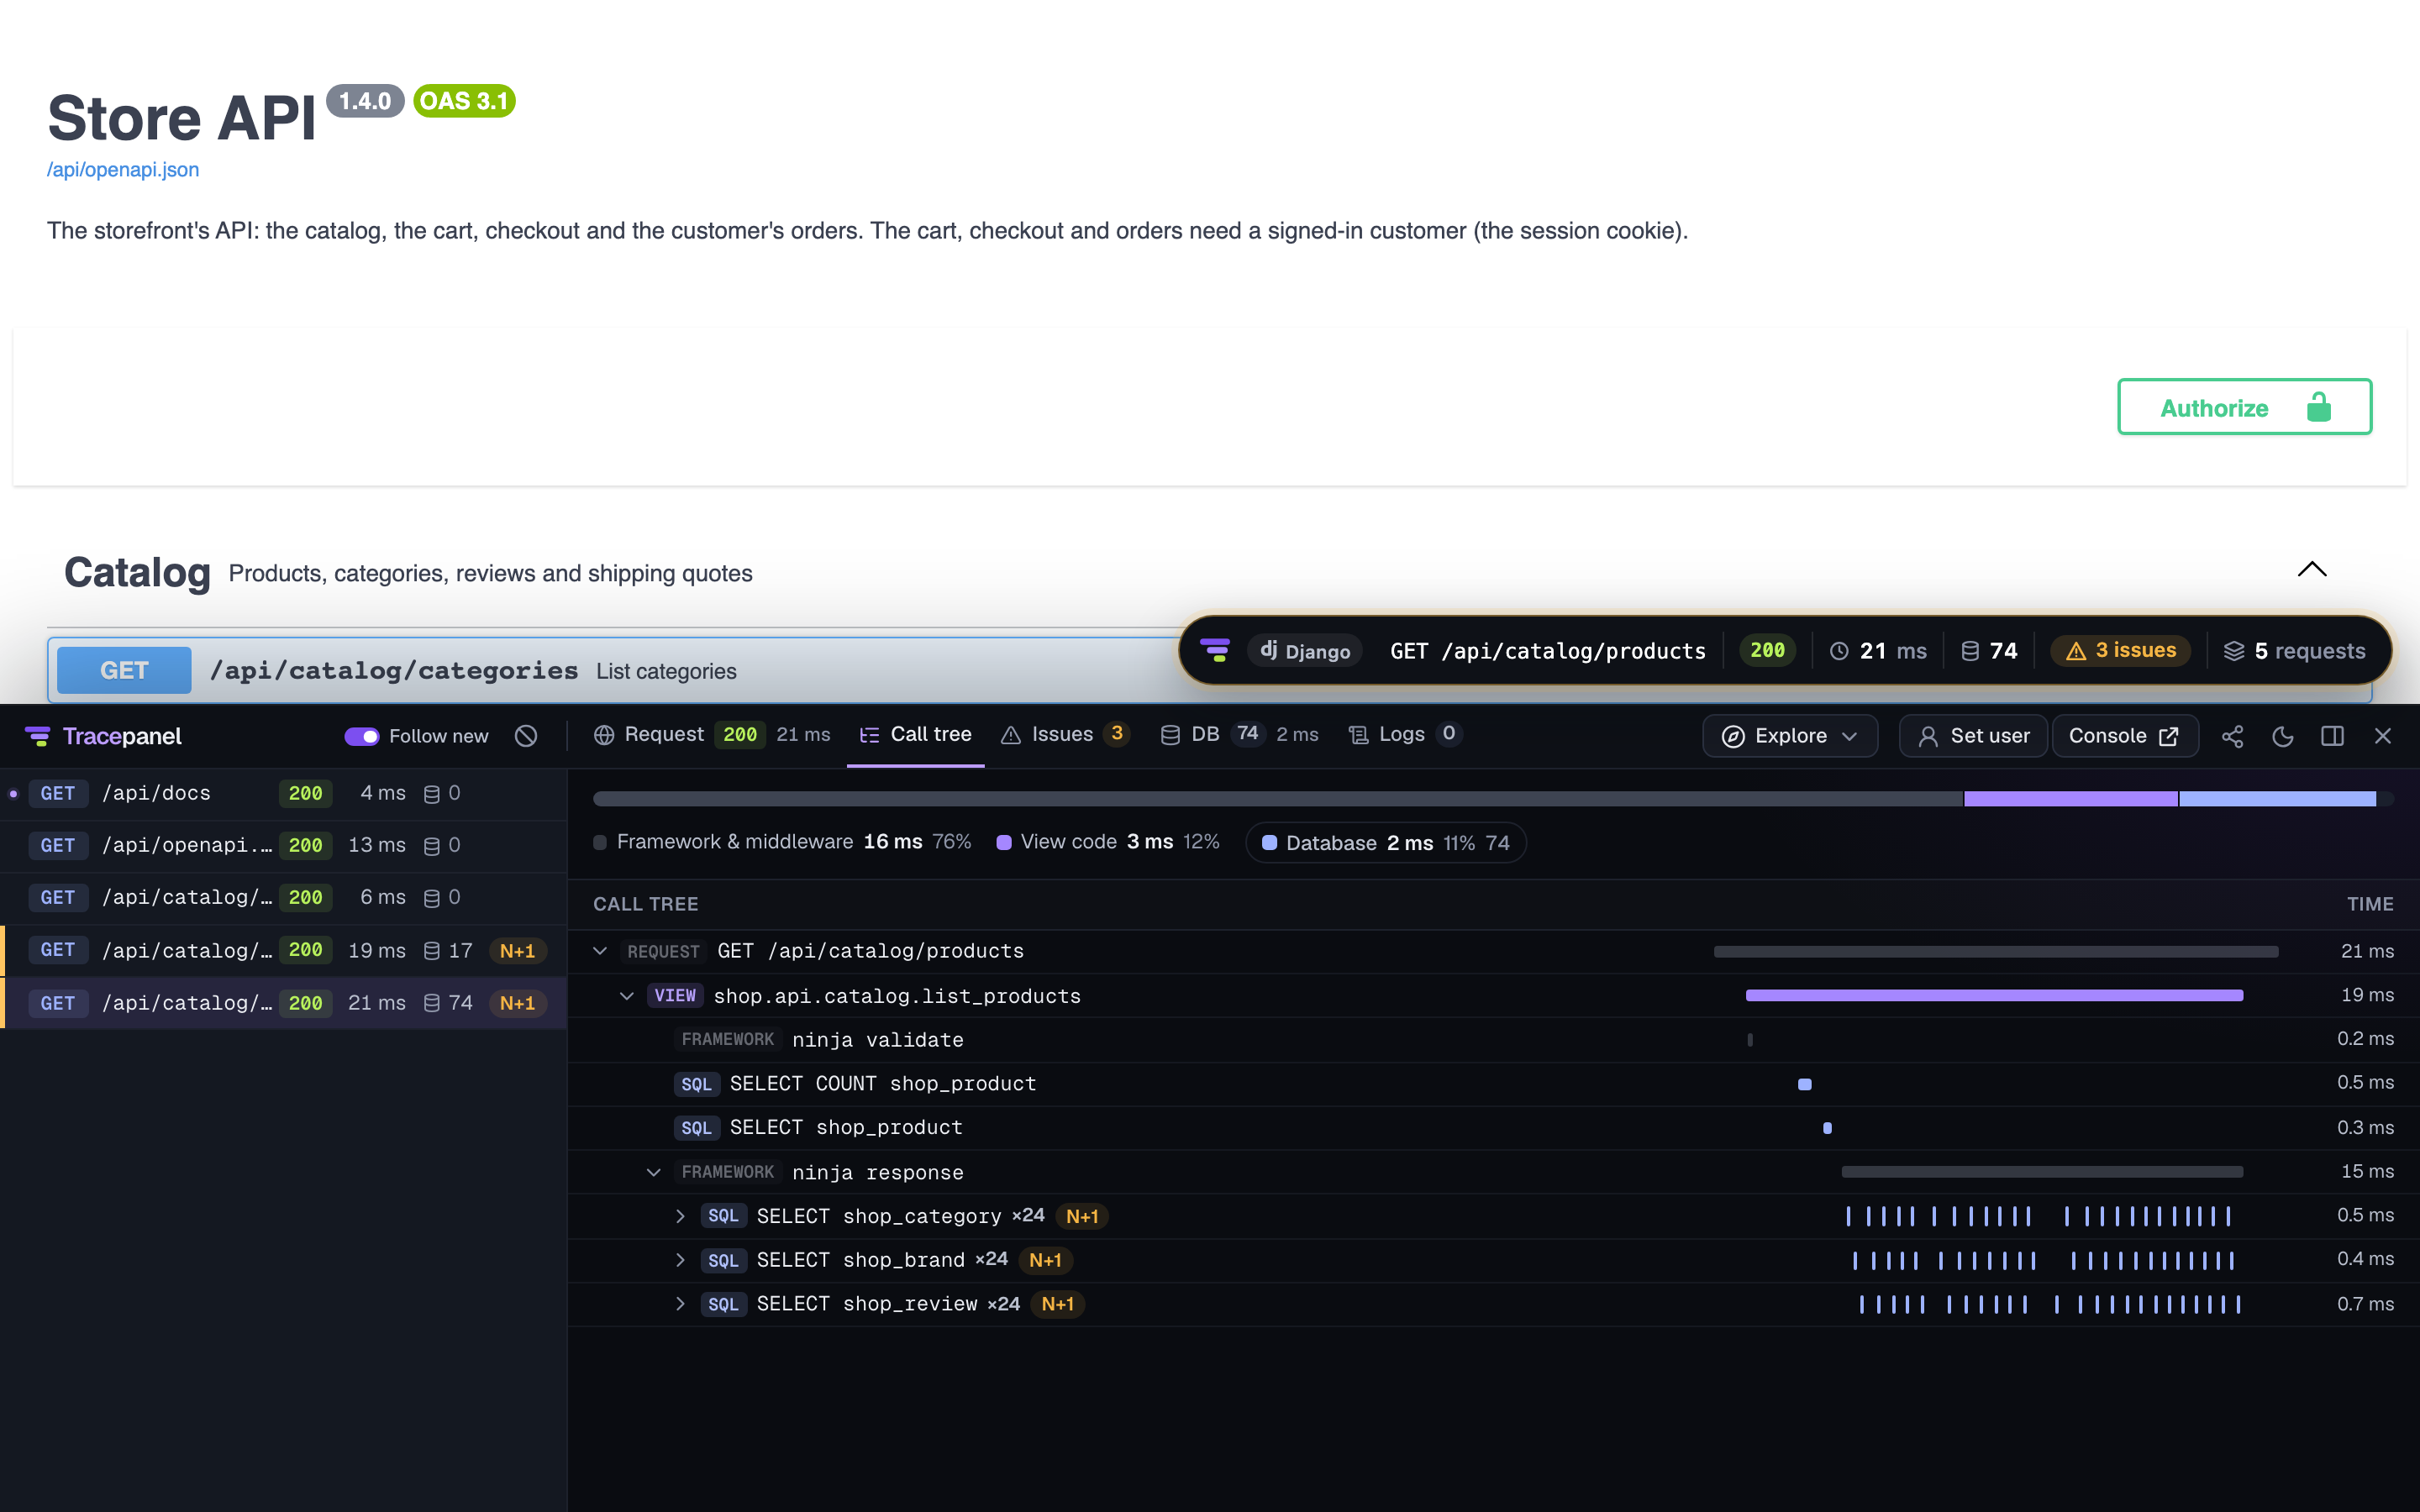
The badge on your pages and the panel it opens, with every request of the browser tab and its call tree, SQL, calls and logs.
Tracepanel adds a badge to the HTML pages of your app. The badge opens a panel
that shows what each request did. The panel lists the page itself and every
fetch() and XHR call the page makes, so a single-page app or Swagger UI shows
its API calls the same way.
The badge
The badge sits in the bottom right corner of the page. It describes the latest
request of the page. When the page loads, that is the page itself. After that,
each new fetch() or XHR call takes its place.
A single-page app from a dev server, such as Vite's, has no traced request of its own. Until its first call to the API, the badge shows the page's view and its load time.
The badge shows these values for that request:
- the method and path, or the GraphQL operation name
- the HTTP status
- the total time, in amber from 300 ms and in red from 1 s
- the number of SQL queries
- the number of issues, in amber
When the page has made more than one request, the badge also shows how many. It counts the other requests that failed with a 5xx status in a red chip. The ring around the badge takes the color of the worst request on the page. It turns amber when a request has issues and red when a request failed.
The hover card
Rest the pointer on the badge, or focus it with the keyboard, and a card opens with more detail:
- A bar of where the time went, split into framework and middleware, view code, your code, templates, database, Redis, cache, datastores, messaging, external calls and email. A line under the bar names the biggest part.
- Fix first lists up to two issues, errors first, each with the code to add and the line it comes from. Click an issue to open it in the panel.
- Other requests on this page lists up to four of the page's other requests, failed and slow ones first. Click one to open it in the panel.
The card stays away while the panel is open. On a touch screen there is no hover, and a tap opens the panel.
Opening the panel
Click the badge to open the panel on the request the badge shows. Click it again or press Esc to close the panel. The panel stays open when you go to another page in the same browser tab.
The panel docks at the bottom of the page by default. The dock button in its toolbar moves it to the right edge and back. Drag the panel's edge to resize it, and double-click the edge to reset its size. Tracepanel remembers the dock and the size for the browser tab.
When the panel is docked on the right and the window has no room for the badge beside it, the badge folds to its logo. The ring keeps its color.
The tab's requests
The panel keeps a list of the pages and requests of the current browser tab.
Each page comes with the fetch() and XHR calls it made. Tracepanel keeps the
list as you move between pages, until you close the tab.
When the JavaScript SDK records the page in the browser, the list also shows
what you did on it. Each view, such as VIEW /books, and each action, such
as CLICK "Save", is a row, with the requests it made under it. A view or an
action opens with its calls, its errors and its console output. See
Pages in the browser.
Docked at the bottom in a window at least 900 pixels wide, the panel shows the list beside the trace, as the browser's Network tab does. The list is titled This tab. The oldest page comes first and new requests arrive at the bottom. If you scroll up to read an older request, a ↓ N new button counts what arrived below. Drag the divider between the list and the trace to resize them.
Docked on the right or in a narrow window, the panel puts the list in a menu at the top. The menu lists the pages and requests of the browser tab. Under it, a strip lists the requests of the current page once the page has made any.
Follow new opens each new request as it arrives. It is on by default. Turn it off to stay on the request you are reading.
Clear starts the list over from the current page. The requests stay in the console. The dialog also has a checkbox that deletes every stored trace for good, with its logs, queries, emails and issues.
A trace's tabs
The panel shows the selected request in tabs. Most tabs appear only when the request has something to show in them:
- Request shows the status and the time on the tab itself. The tab shows the URL, the route, the view, the user, what served the request and every attribute of the trace. A task shows Task with its outcome, and a command shows Command. Under Related traces, the tab lists the traces this one is linked to: the tasks it queued, the trace that queued it, and a call to another app that another project's agent recorded, with a link to that project's console.
- Call tree shows what the request did, in order: middleware, the view, SQL, calls to Redis, caches, HTTP APIs and other systems, templates, signals, emails, queued tasks and logs.
- Error shows the exception with its stack and the local variables of your code. It appears when the request raised one.
- Issues lists the issues Tracepanel found, each with the line of code it comes from and the fix. It appears when there are issues. See Issues.
- DB lists the SQL queries with their count and total time on the tab.
- Cache lists the cache calls, and HTTP calls lists the outgoing HTTP calls.
- Logs lists the log records of the request. It is always there, with their count on the tab. See Logs.
Calls to other systems, such as Redis used directly, MongoDB or a broker, are in the call tree. The console has a page for each system. An email is in the call tree too, and the console's Emails page lists them all.
The keys 1 to 9 open the tabs in the order they are shown.
The panel opens on the tab you used last. A request with an error opens on Error. Without a choice and without an error, the panel opens on Call tree.
Call tree
A row on top of the call tree splits the request's time between framework and middleware, view code, your code, templates, database, Redis, cache, datastores, messaging, external calls and email. A part with rows in the tree, such as DB or Cache, is also a filter chip with their count. Click a chip to narrow the tree to those rows.
The other chips follow in the same row: Signals, Templates, Tasks, Transactions, Mail, GraphQL, Channels, Functions, Logs and Errors. A chip appears only when the request has such rows. With a filter on, the tree keeps the matching rows and the rows that lead to them.
Three or more identical queries or calls under the same parent fold into one row with a count, such as ×50. The row sits where the first one ran. A row that is part of an issue carries its mark.
A task the request queued shows under the row that queued it. When a worker has run it, the row links to the task's own trace. Until then it reads "waiting for a worker…". A call that reached another app shows that app's trace under the call.
Click a row to see its details: the kind, when it started, how long it took, the formatted SQL and every attribute. Click it again to close them. When the call tree is wide, the details open in a pane beside it. Drag the pane's edge to resize it, or focus the edge and use the arrow keys. Double-click the edge to reset its width. When the call tree is narrow, the details open under the row.
Issues

Each issue names its kind, its title, the culprit line and the fix. Show N queries switches to the tab of the issue's calls, such as DB, with the calls highlighted. For calls without a tab of their own, it opens the call tree. All occurrences opens the issue in the console with every request it happened in.
DB
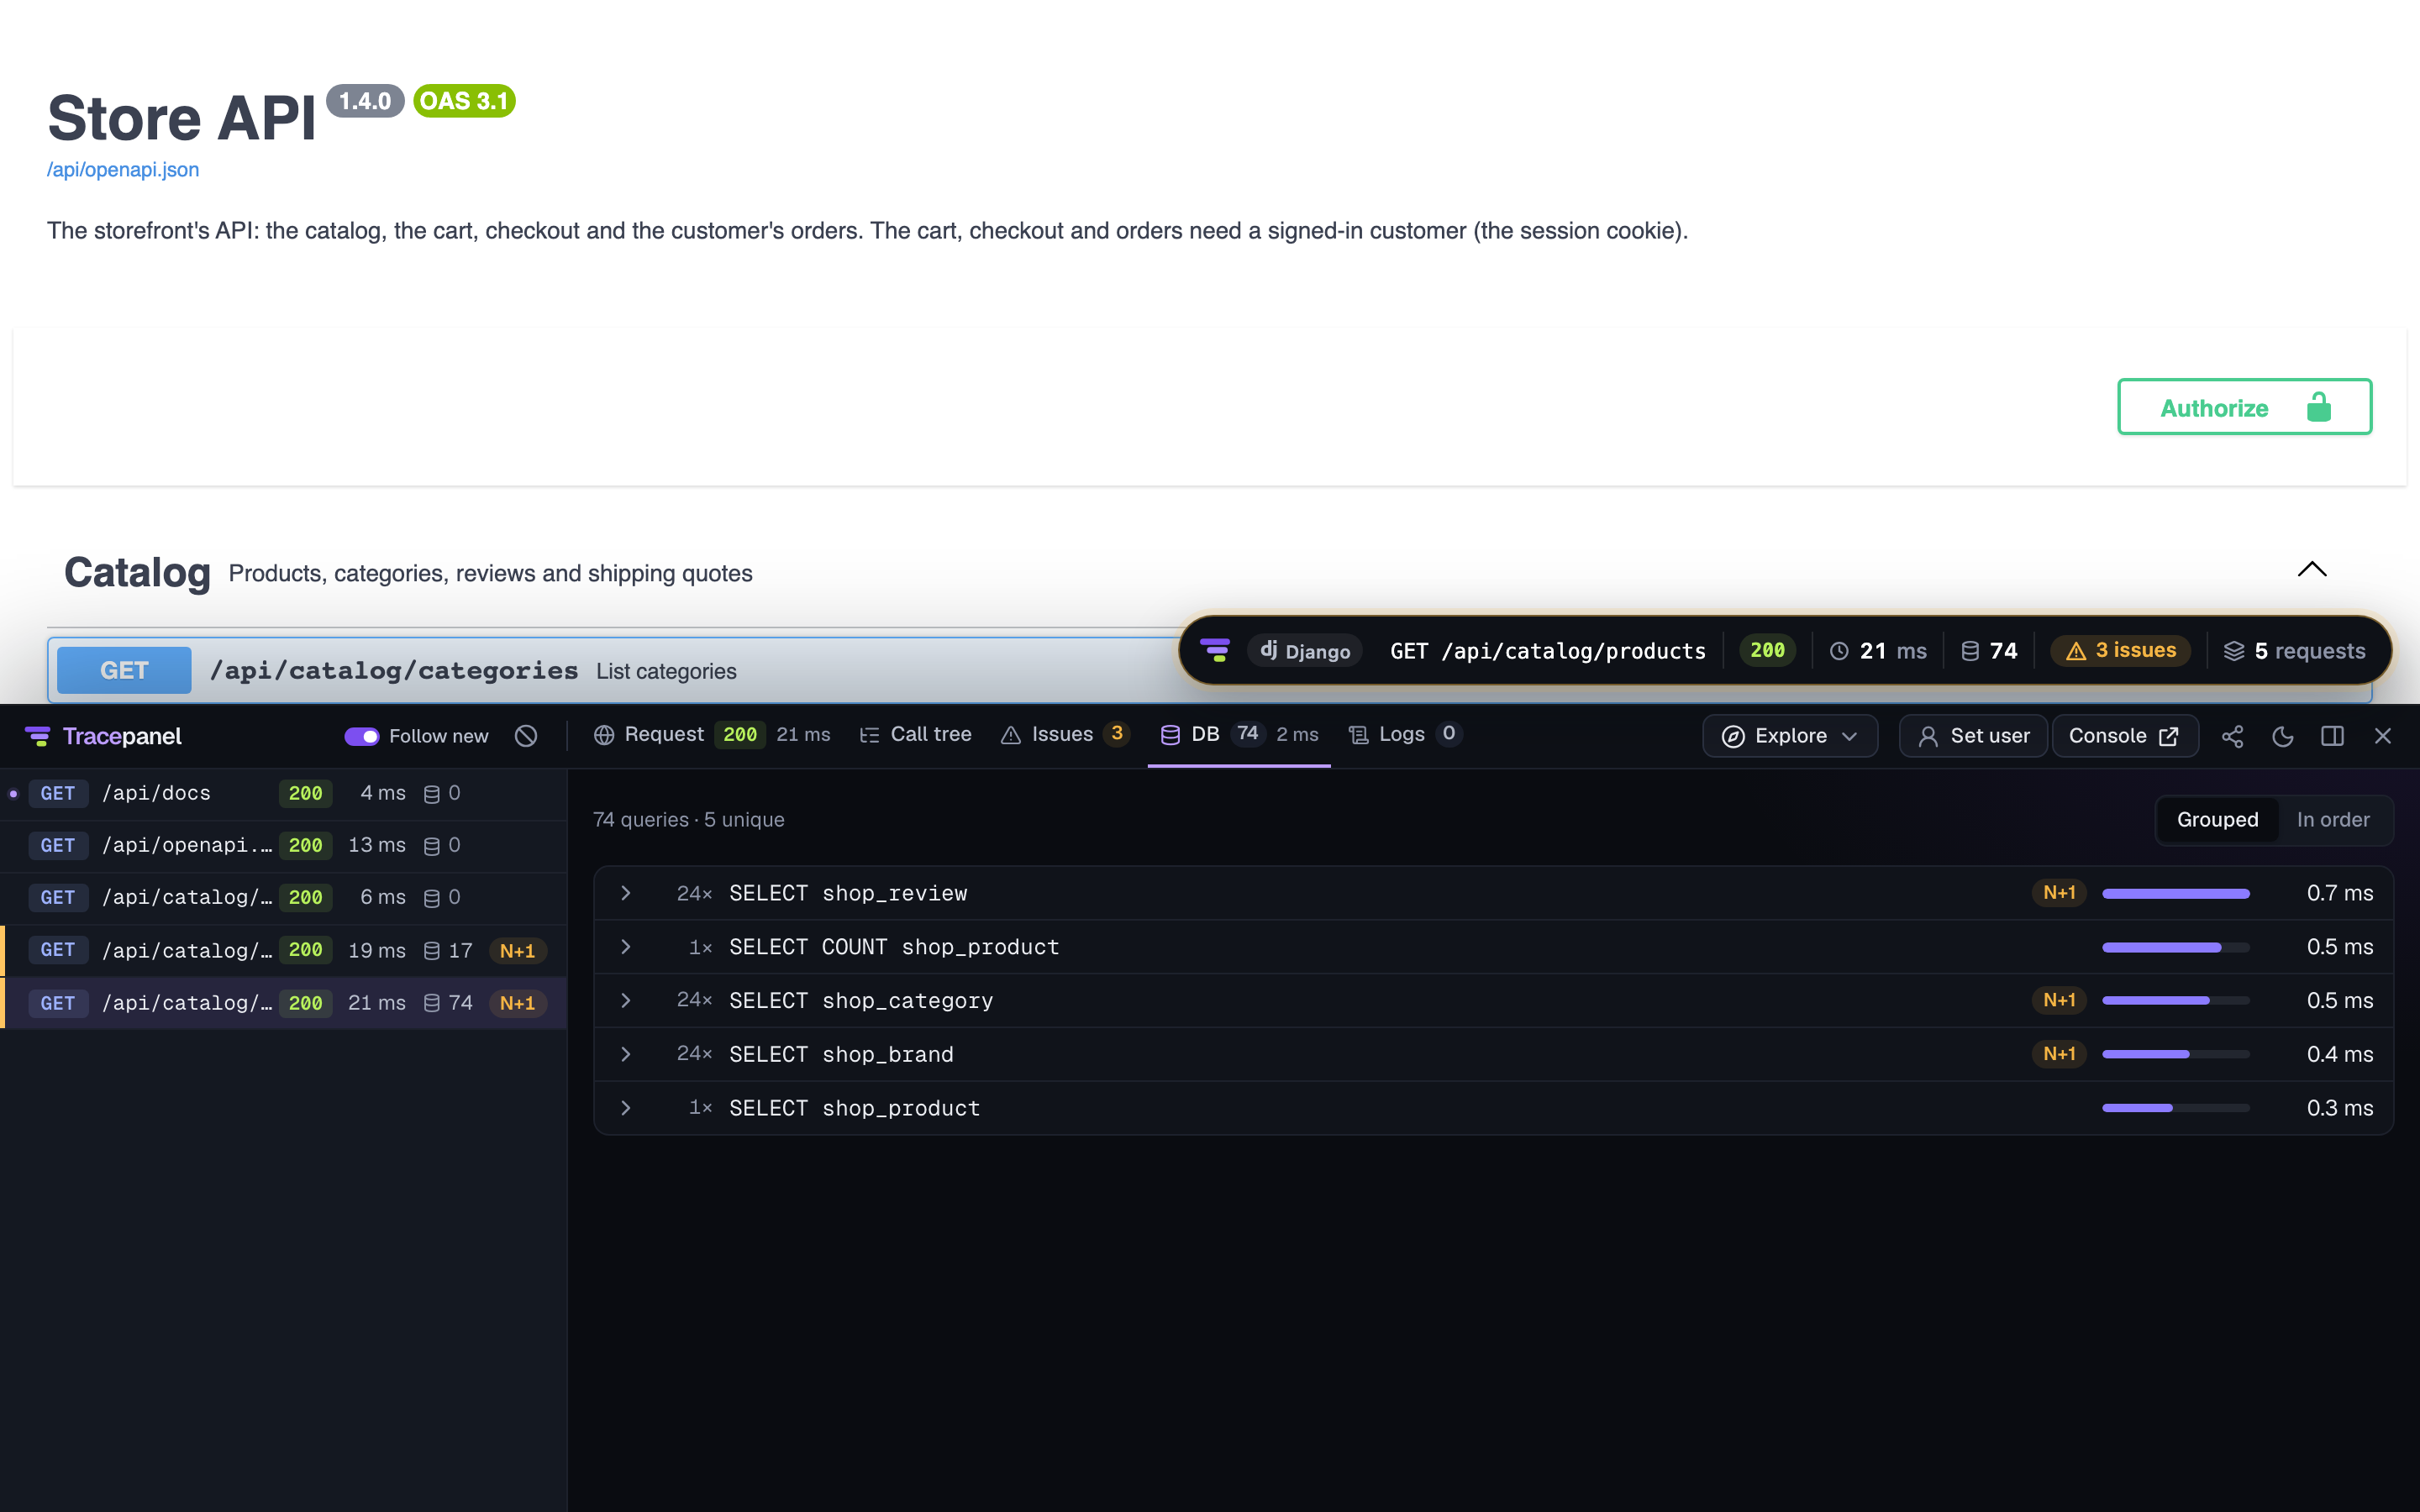
The DB tab folds the queries into statements by default. Each row shows how many times the statement ran and its total time. In order lists every query as it ran instead.
Open a row to see the statement and the place in your code it came from. For a
SELECT, Explain runs EXPLAIN and shows the plan. Explain analyze
runs the query to measure the real time and rows. Your app runs them, on a
connection of its own, so the buttons show only while the app that recorded
the query is running. The Python SDK and the JavaScript SDK, with pg or
mysql2, both run them.
The Cache and HTTP calls tabs work the same way. They group the calls by key
pattern or endpoint, such as user:{id} or GET api.example.com/users/{id}.
Logs
The Logs tab lists the request's records with their time, level, message and logger. Click a record to see its message and every field, the same details the call tree shows. In the call tree opens the call tree at the row the record was logged in. A link at the top opens the records in the console's Logs page, where you can filter and search them.
The toolbar
Explore in the toolbar leads to what the trace page doesn't show itself:
- every call of the same endpoint, operation, task or job, with its latency, errors and issues
- up to three of the request's issues, each across every request it happened in
- the logs of every request, task and job from 30 seconds before the request to 30 seconds after it
Console opens the request in the full console in a new tab.
Share, the share icon, opens a dialog that downloads the request as one HTML file that opens anywhere. Include values in the dialog keeps the values that otherwise stay on your machine. See Sharing a trace.
The theme button cycles between the system theme, light and dark. Press ⌘K or Ctrl+K to search traces from the panel.
Switching the user
In a Django project, the panel can show your site as another user. The Set user or Change user button in the toolbar opens a search by username, name or email. Pick a user and the page reloads as that user. Log out returns to an anonymous visitor.
The button appears only when all of these are true:
DEBUGisTrue.django.contrib.authanddjango.contrib.sessionsare installed.- The
user_switchsetting is on. It is on by default. - The request comes from this machine or from an address in
INTERNAL_IPS.
Tracepanel accepts a switch only from the page itself. See Safety in the Django guide.