The console
The console at /__tracepanel__/ shows every request, task, command, call and log record your app recorded, with charts and one search.
The panel shows the requests of one browser tab. The console shows everything your app recorded: HTTP endpoints, GraphQL operations, tasks, WebSocket consumers, jobs and RPC methods, with their SQL, calls to other systems, logs, emails, errors and issues.
Open /__tracepanel__/ on your app. The agent also serves the console on its
own address, and the summary lines Tracepanel prints in the terminal for tasks
and commands link there. With the agent in the foreground, as in
tracepanel-agent --serve 127.0.0.1:8765, the console is at
http://127.0.0.1:8765/. See How it works.
Sections
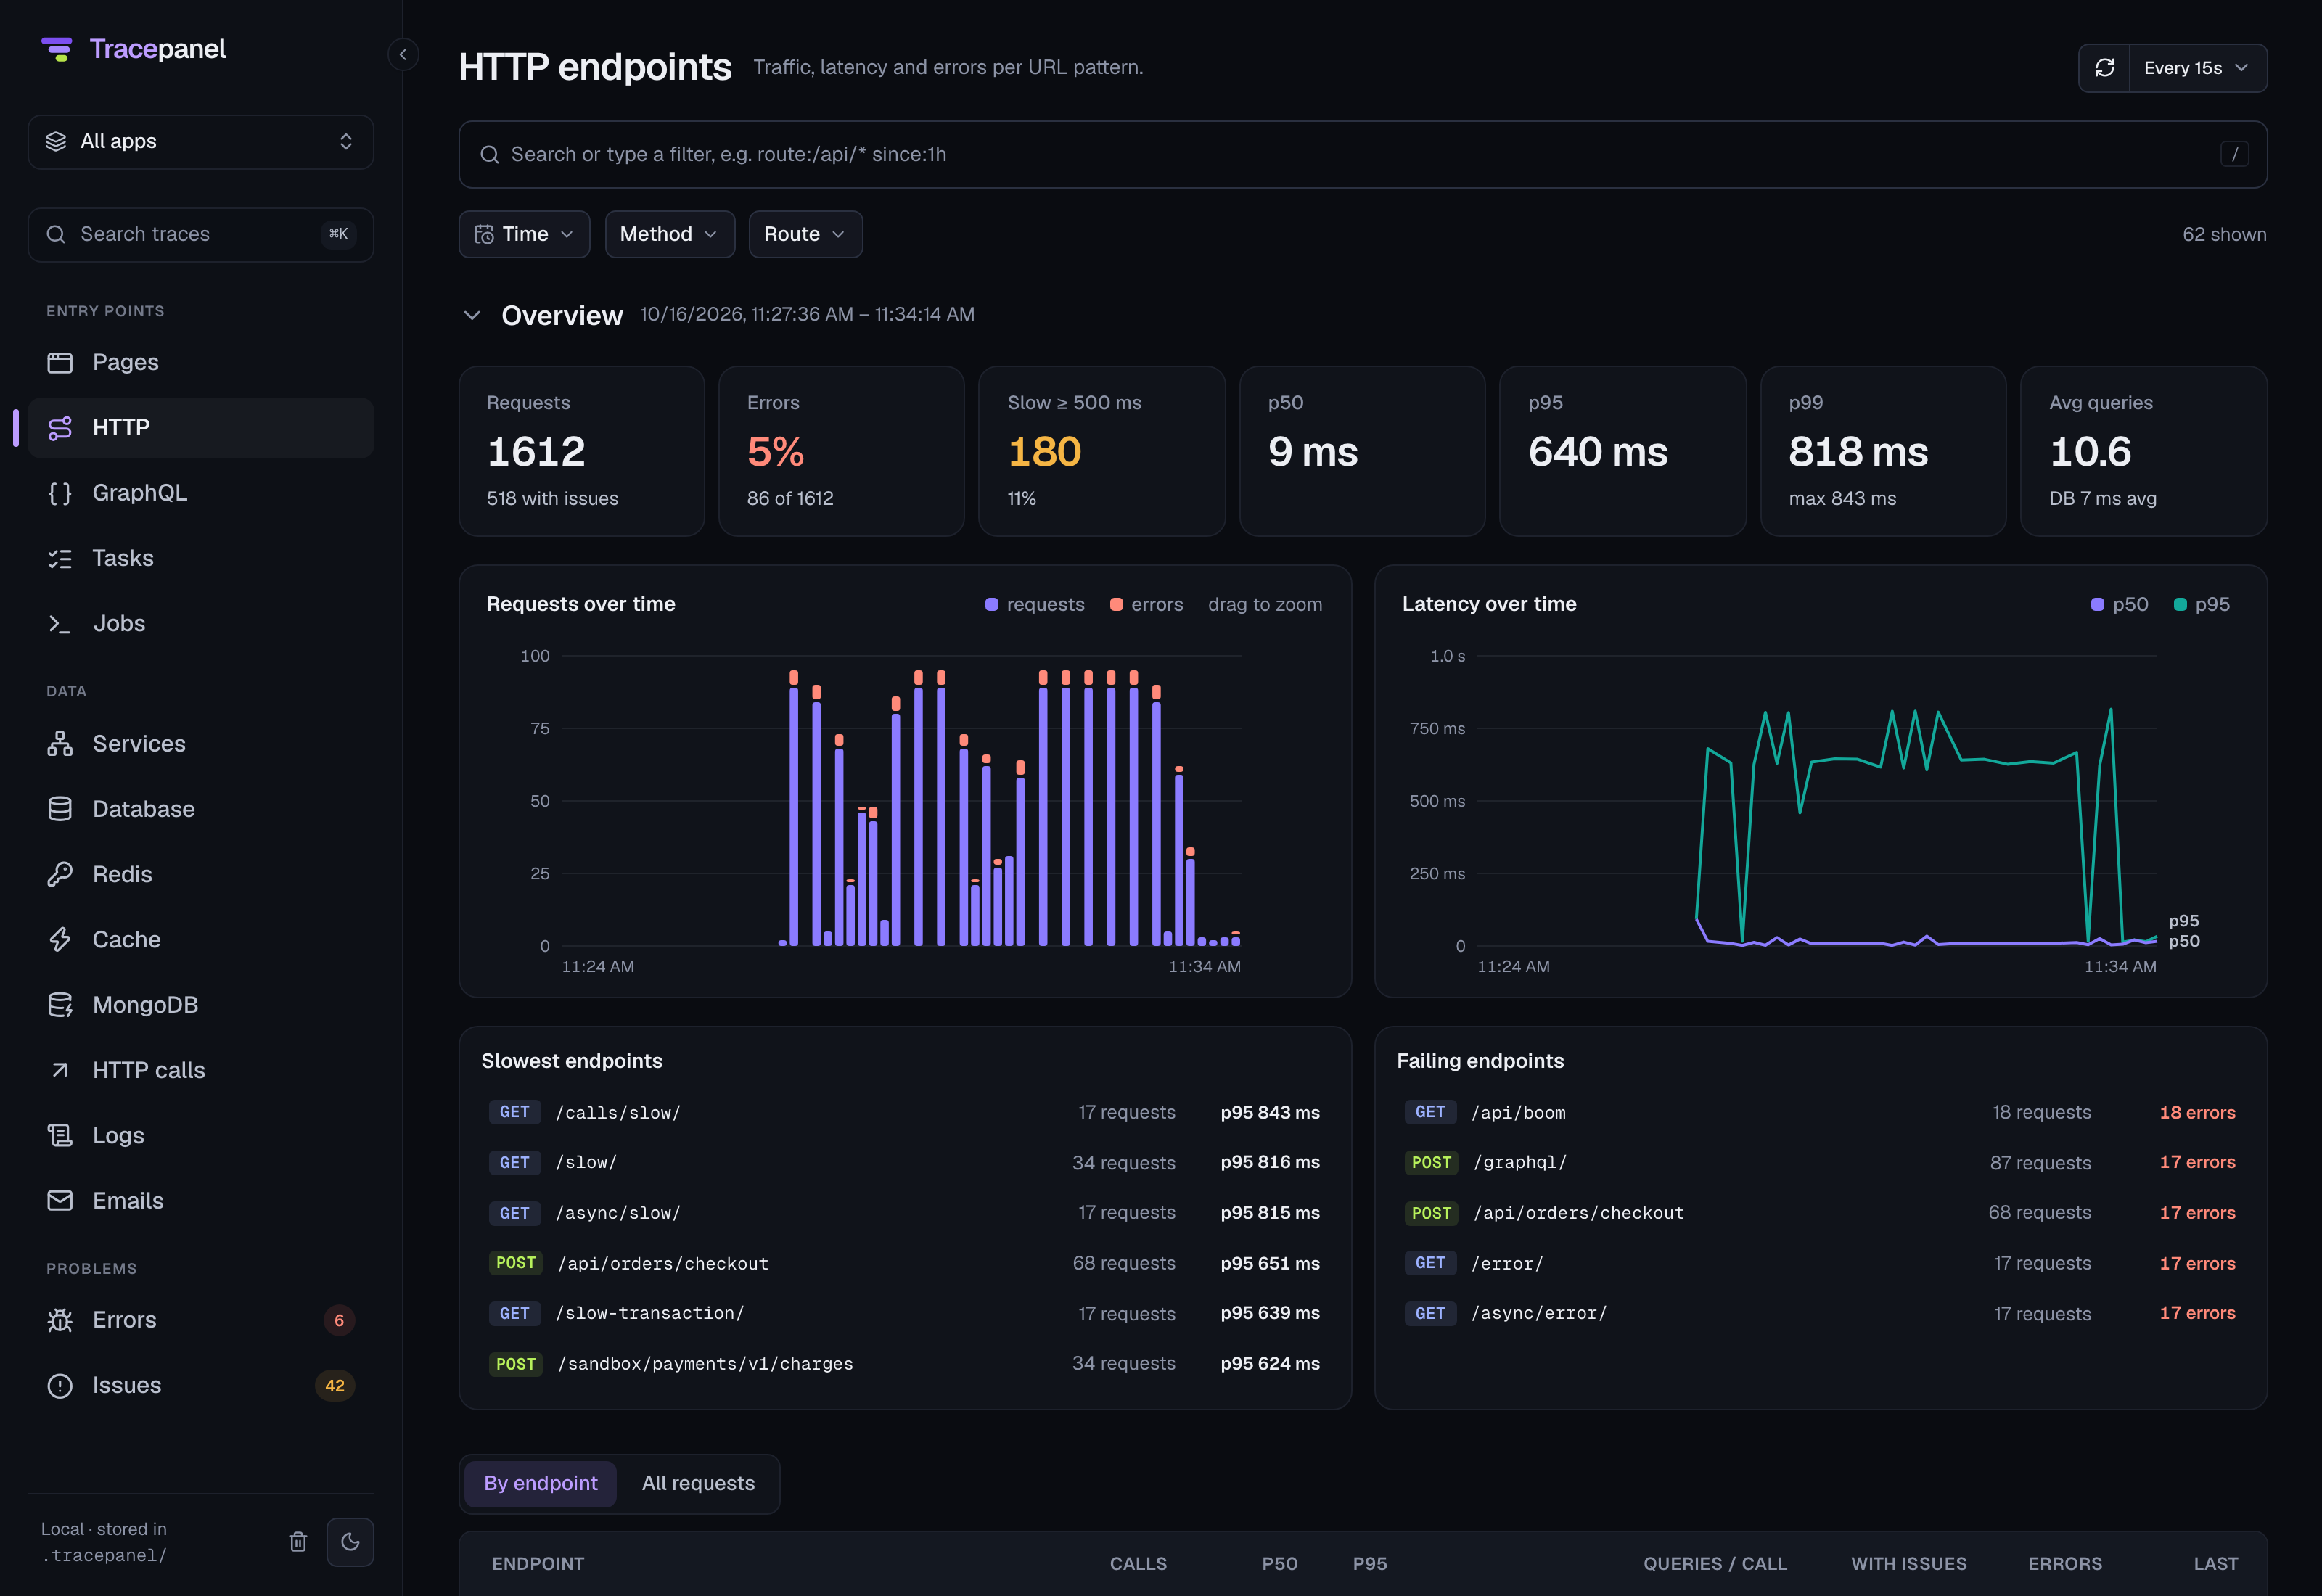
The sidebar lists the sections in three groups. The console opens on HTTP.
Entry points
Each entry point is one kind of work that comes into your app:
- Pages lists the pages users viewed in the browser and what they did on them. See Pages.
- HTTP lists endpoints by method and URL pattern, with their traffic, latency and errors.
- GraphQL lists operations by name, with their traffic, latency, errors and queries per call.
- Tasks lists task runs, with failures, retries and the time each task waited in the queue.
- WebSockets lists WebSocket consumers, with their connections, messages, errors and handler time.
- Jobs lists commands and the blocks your code wraps in a trace of its own.
- RPC lists the methods your app serves over gRPC and other RPC systems,
such as
helloworld.Greeter/SayHello, with their calls, failures and latency.
HTTP is always in the sidebar. The other entry points appear once Tracepanel has stored a trace of their kind. A project without a task queue has no Tasks section.
In the Python SDK
Tasks come from Celery, Dramatiq, RQ and Django Tasks, and WebSockets from
Django Channels consumers. Jobs are management commands and the blocks your
code wraps in tracepanel.trace(). See
Integrations and
Tracing your code.
Pages
Pages come from the browser, when the JavaScript SDK records a single-page
app's pages. See Pages in the browser. Each view
of a page, its load or a route change, is a row, and what users did on it is
listed under it: a click or a submit that called the API, such as /books › click "Save", and the calls the page made in the background. Each row shows
how many times it happened, its failures, its time and the calls it made to
the API, and opens a page of its own. page: searches them.
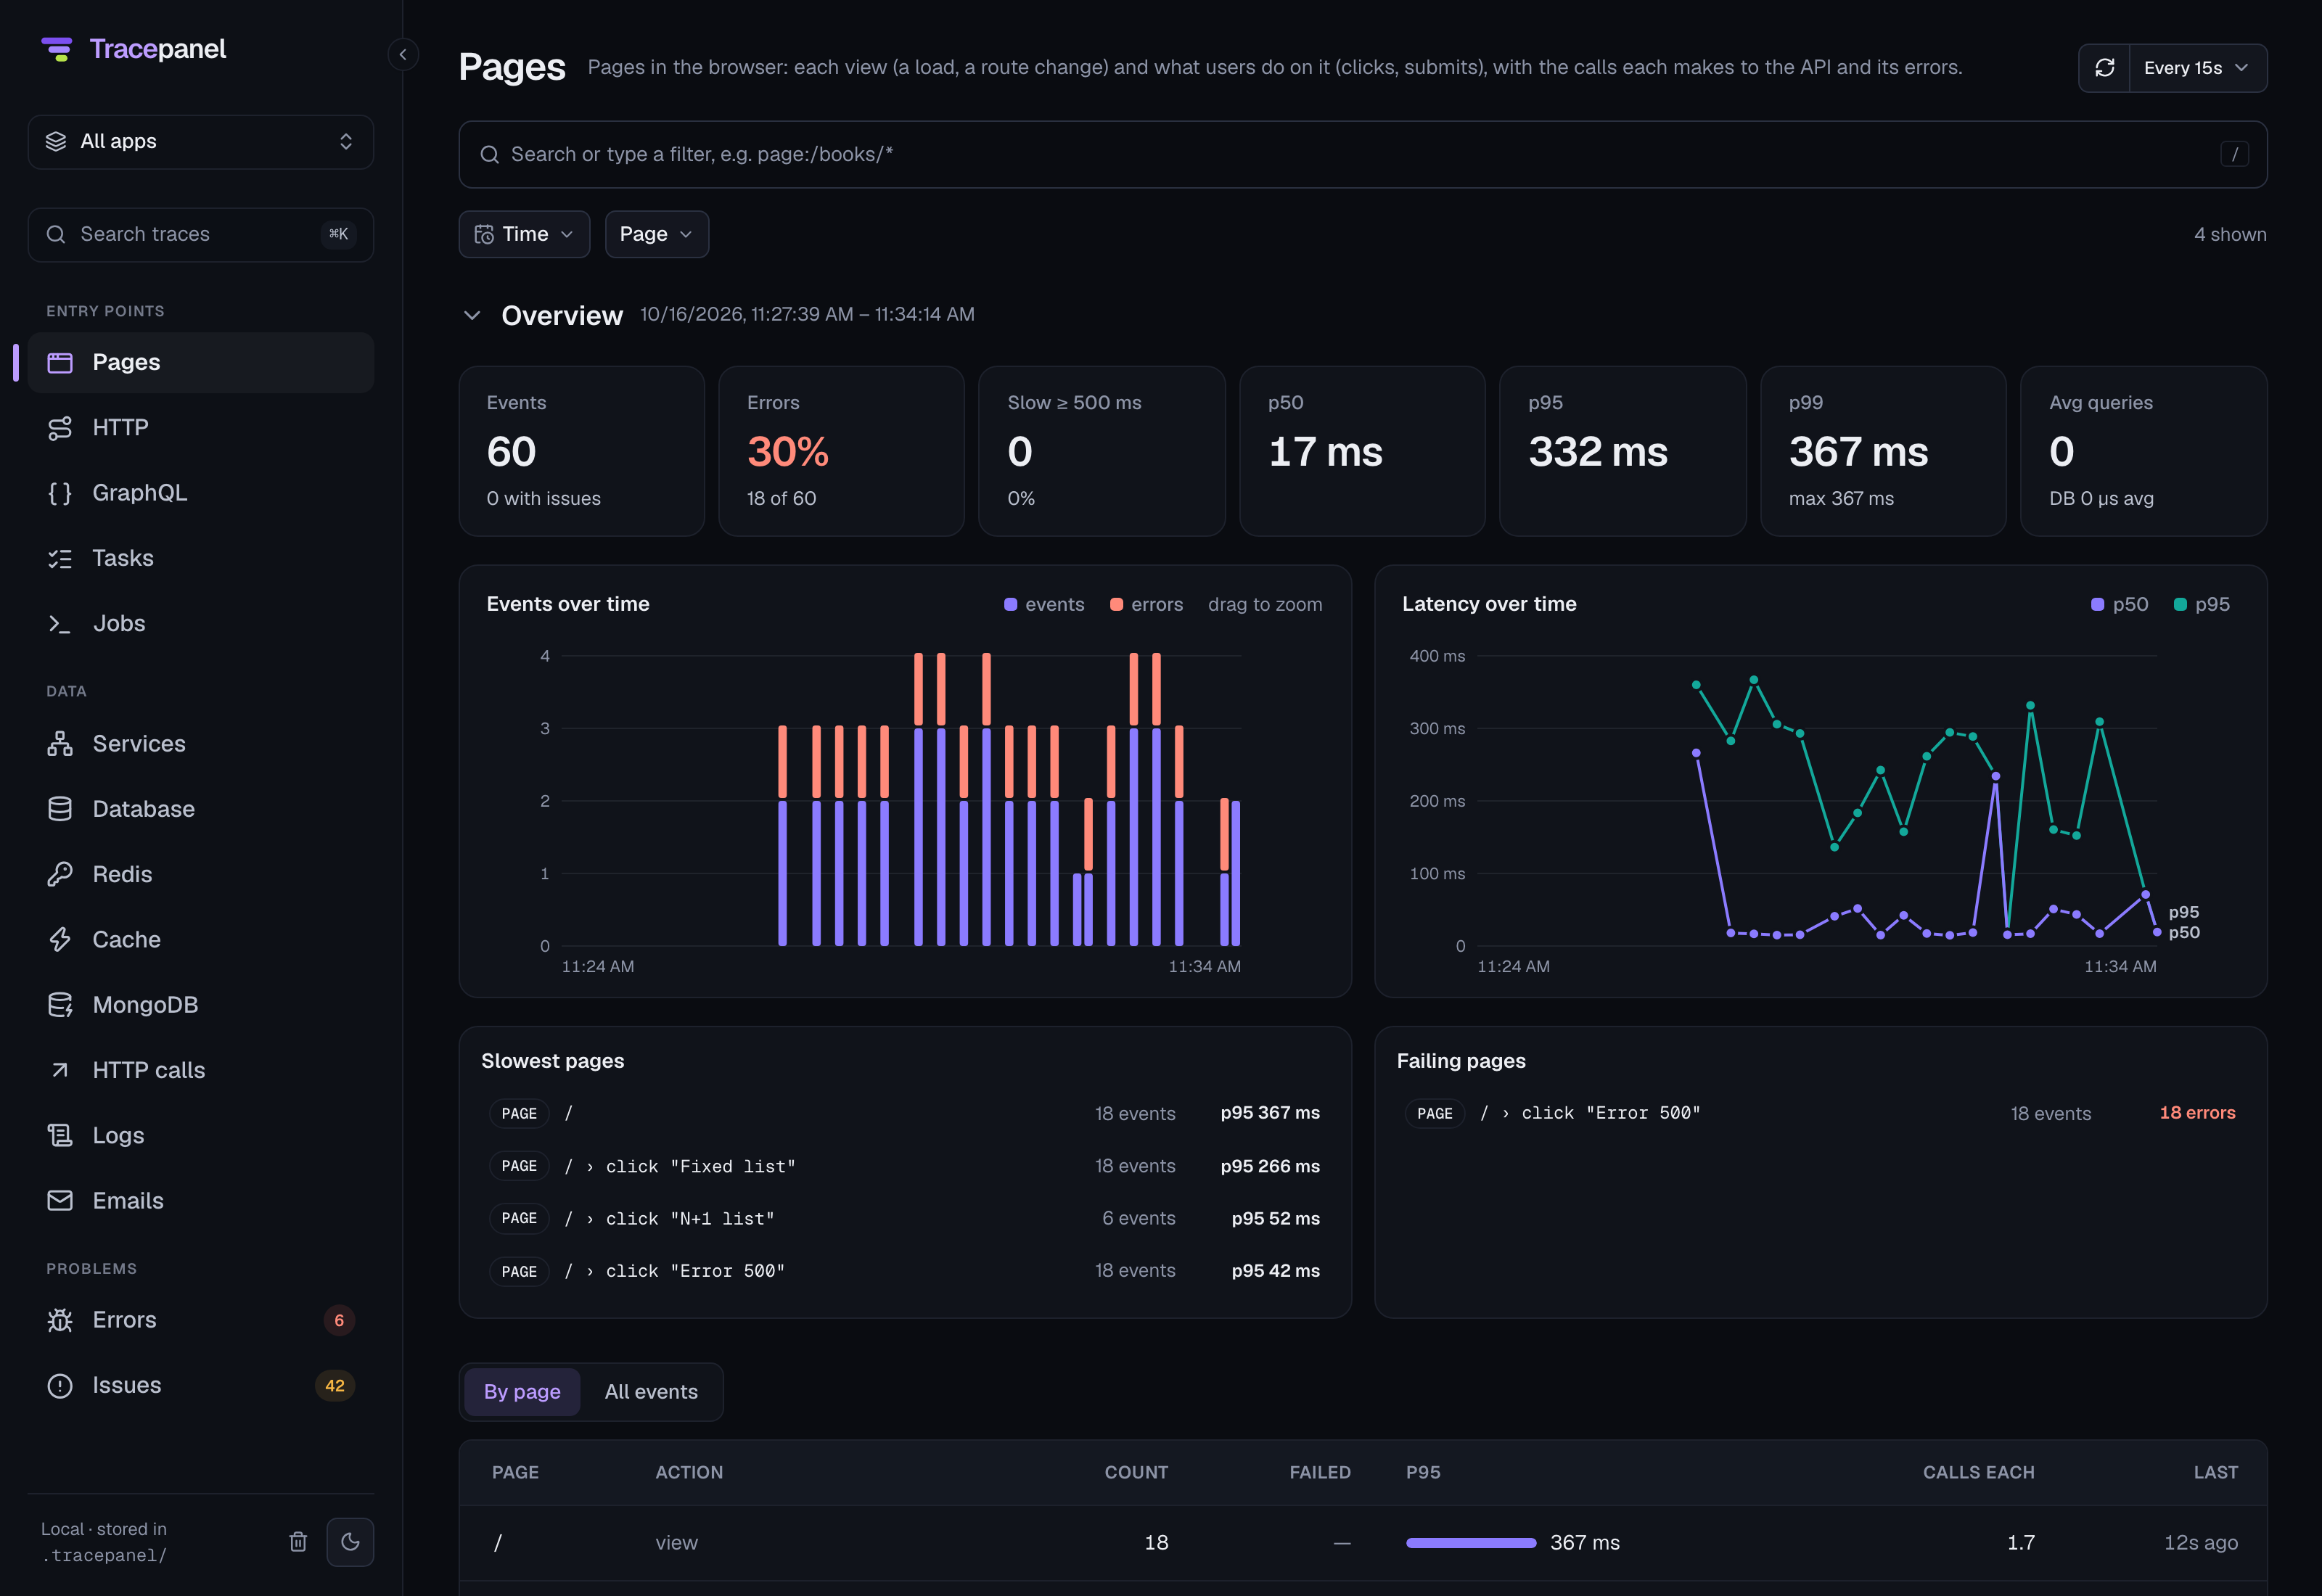
A view or an action opens like any trace. Its calls to the API link to the API's traces, its errors come with their stack, and its console output with the line that logged it.
RPC methods come from OpenTelemetry. A server span at the root of a trace with
an rpc.system attribute, such as a gRPC server's, becomes a trace of the kind
rpc, named Service/Method. See
OpenTelemetry.
Each entry point starts with an overview. It shows the number of calls and how many had issues, the errors, the p50, p95 and p99 latency, and the average number of queries and database time. A chart shows the calls over time. Drag across the chart to zoom into a time range. Two lists show the slowest groups by p95 and the failing groups.
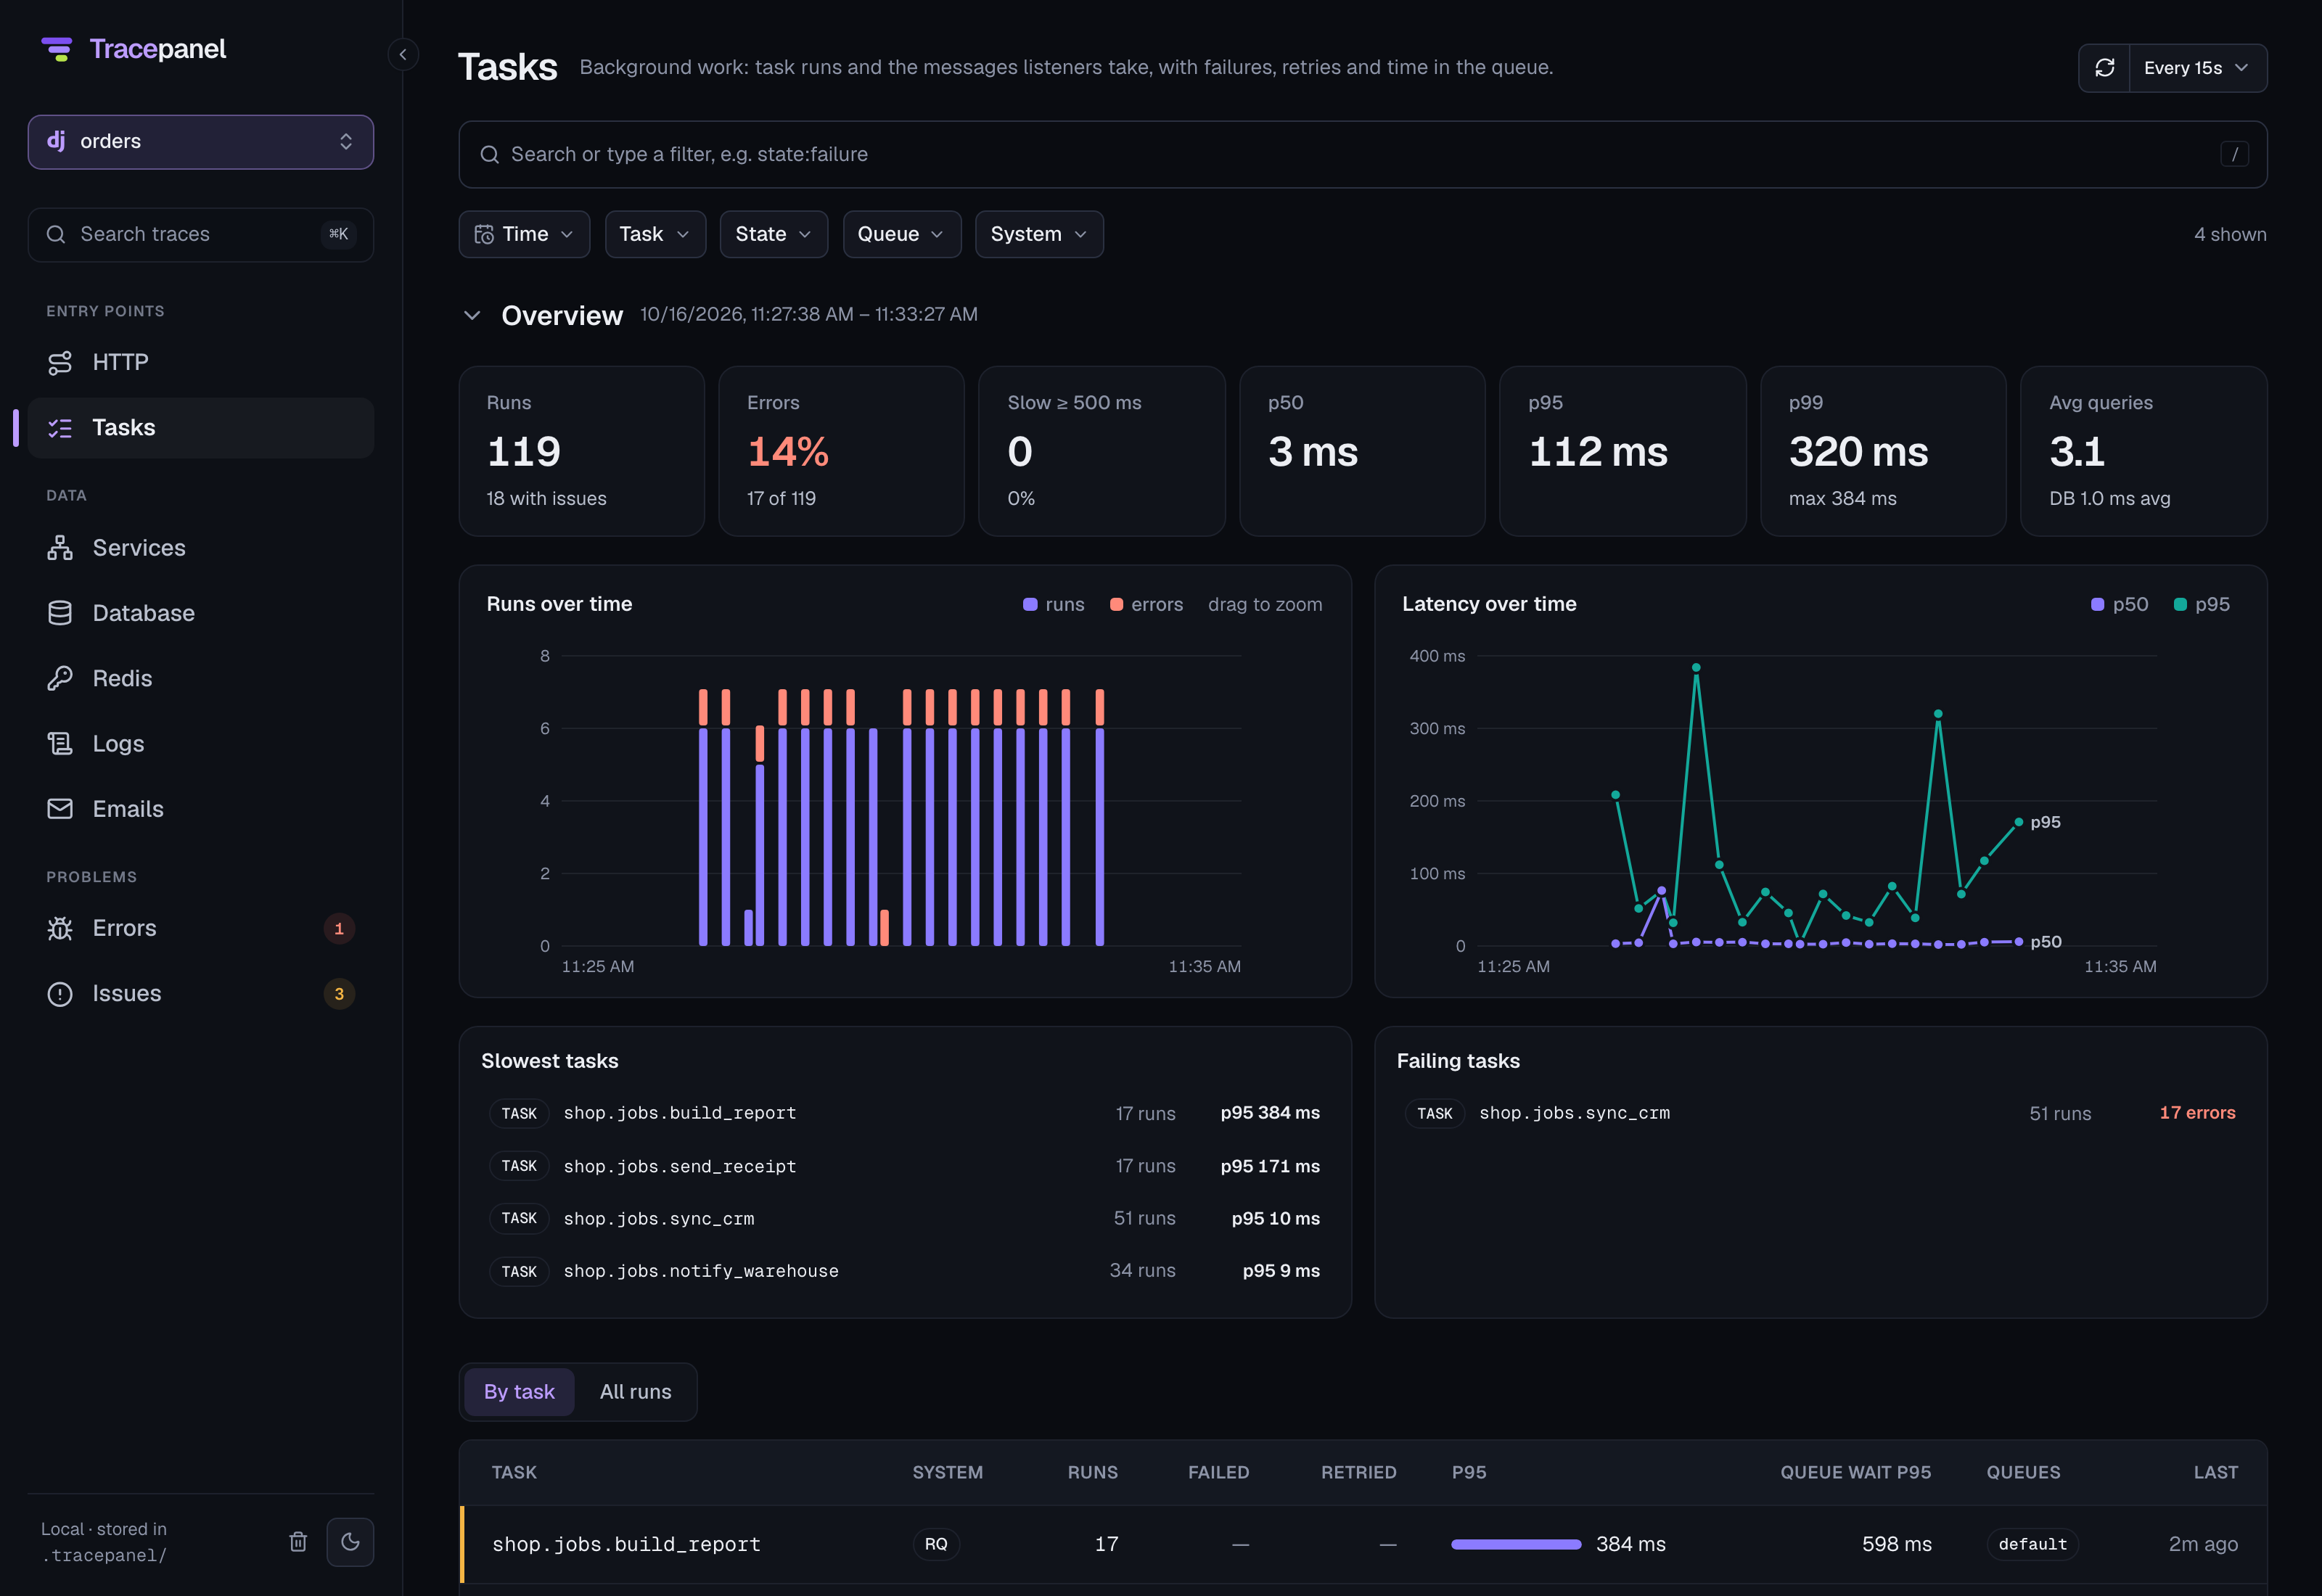
Under the overview, the page lists the calls. By endpoint, By operation, By task, By consumer, By job or By method groups them. The other choice, such as All requests or All runs, lists every call, newest first. A group opens a page with that endpoint, operation, task, consumer, job or method over time. A call opens its trace.
Data
The data sections show what your app's work touched:
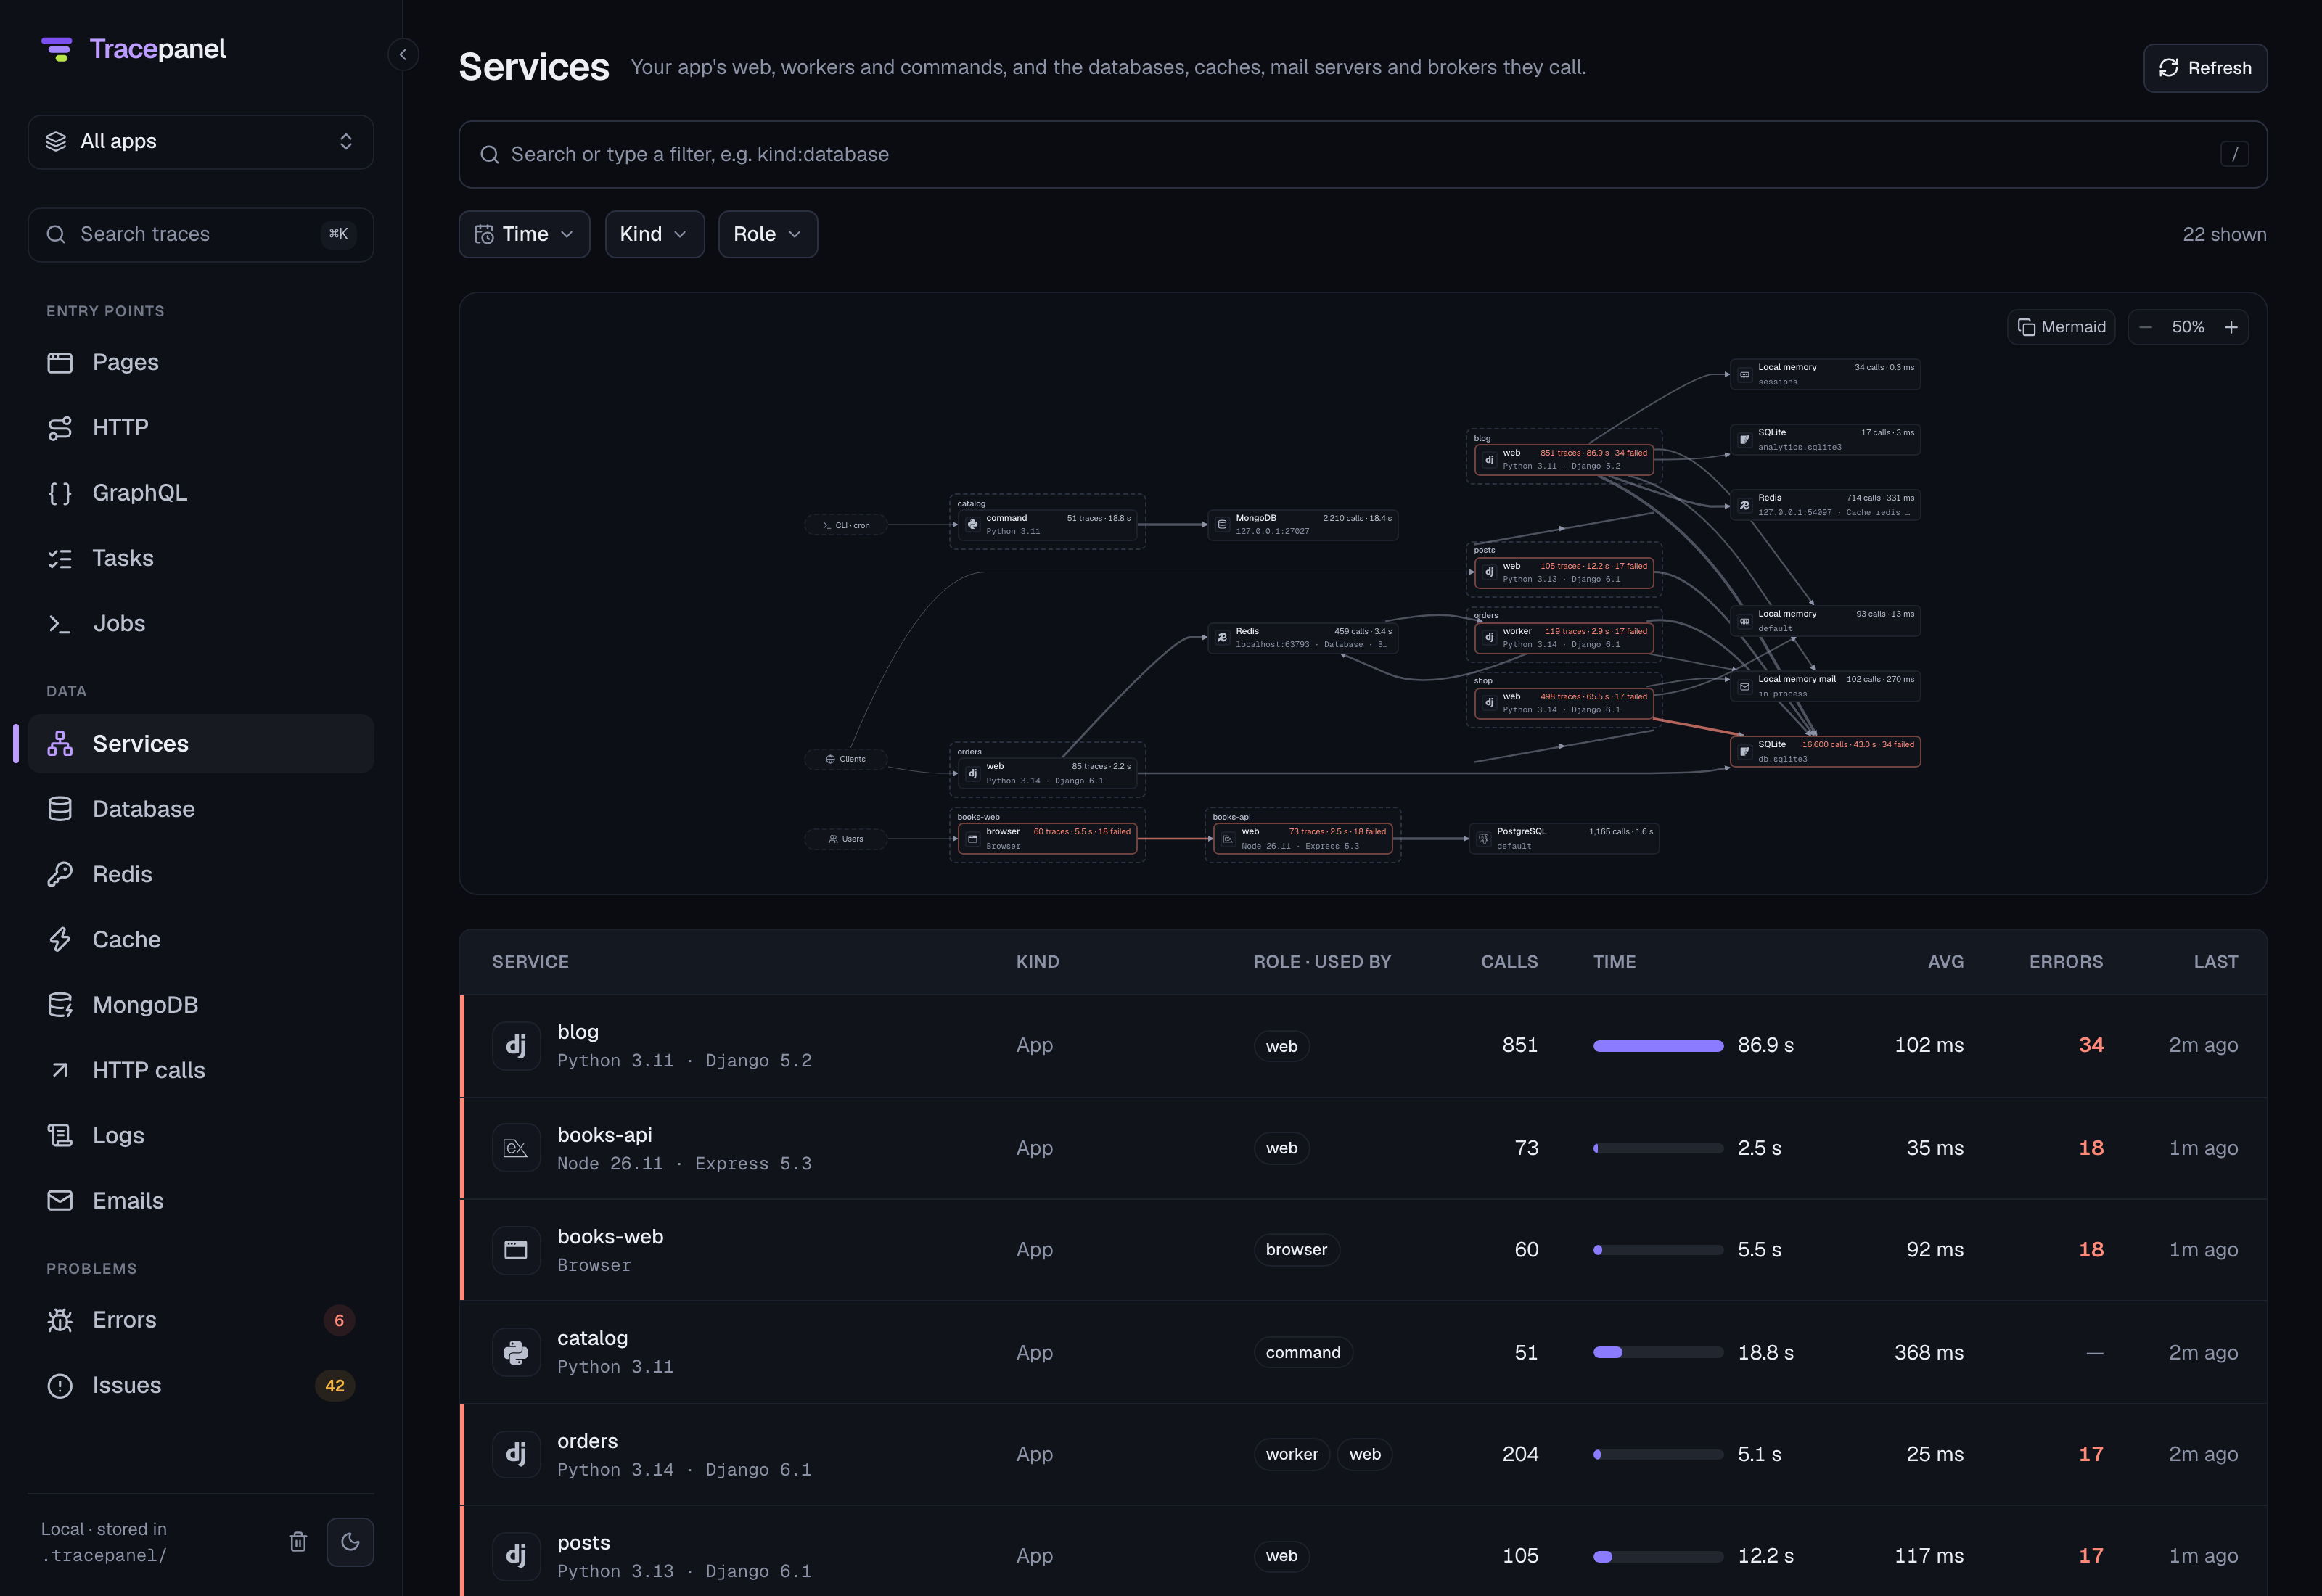
- Services draws your project's architecture from its calls. See Services.
- A page for each system your app called, such as Database, Redis, Cache, HTTP calls or MongoDB. See Systems.
- Logs lists the log records of every request, task and job. See Logs.
- Emails lists every email your app sent, with the request that sent it.
Services
The Services page draws where work comes into your project, the apps and their roles, such as web, worker or command, and the servers they call: databases, caches, brokers and HTTP APIs. Each call is an arrow, laid out from left to right. An arrow is thicker for more calls and red when calls failed. When one app calls another, the arrow goes from app to app. Work that comes from the browser starts at Users, and a browser app's row opens its Pages.
Each app shows the language and the framework it runs on, with their versions, such as Python and Django, Node and Express, or Java and Spring Boot. They come from the app's latest trace, so an upgrade shows at once. Hover a box to bring out its arrows, and click an arrow to open its traces.
Each server is one box, however many ways your app uses it. Redis used as a datastore and as a cache backend is one box. Copy as Mermaid puts the same diagram on the clipboard, for a README or an issue. A table under the diagram keeps the numbers.
Systems
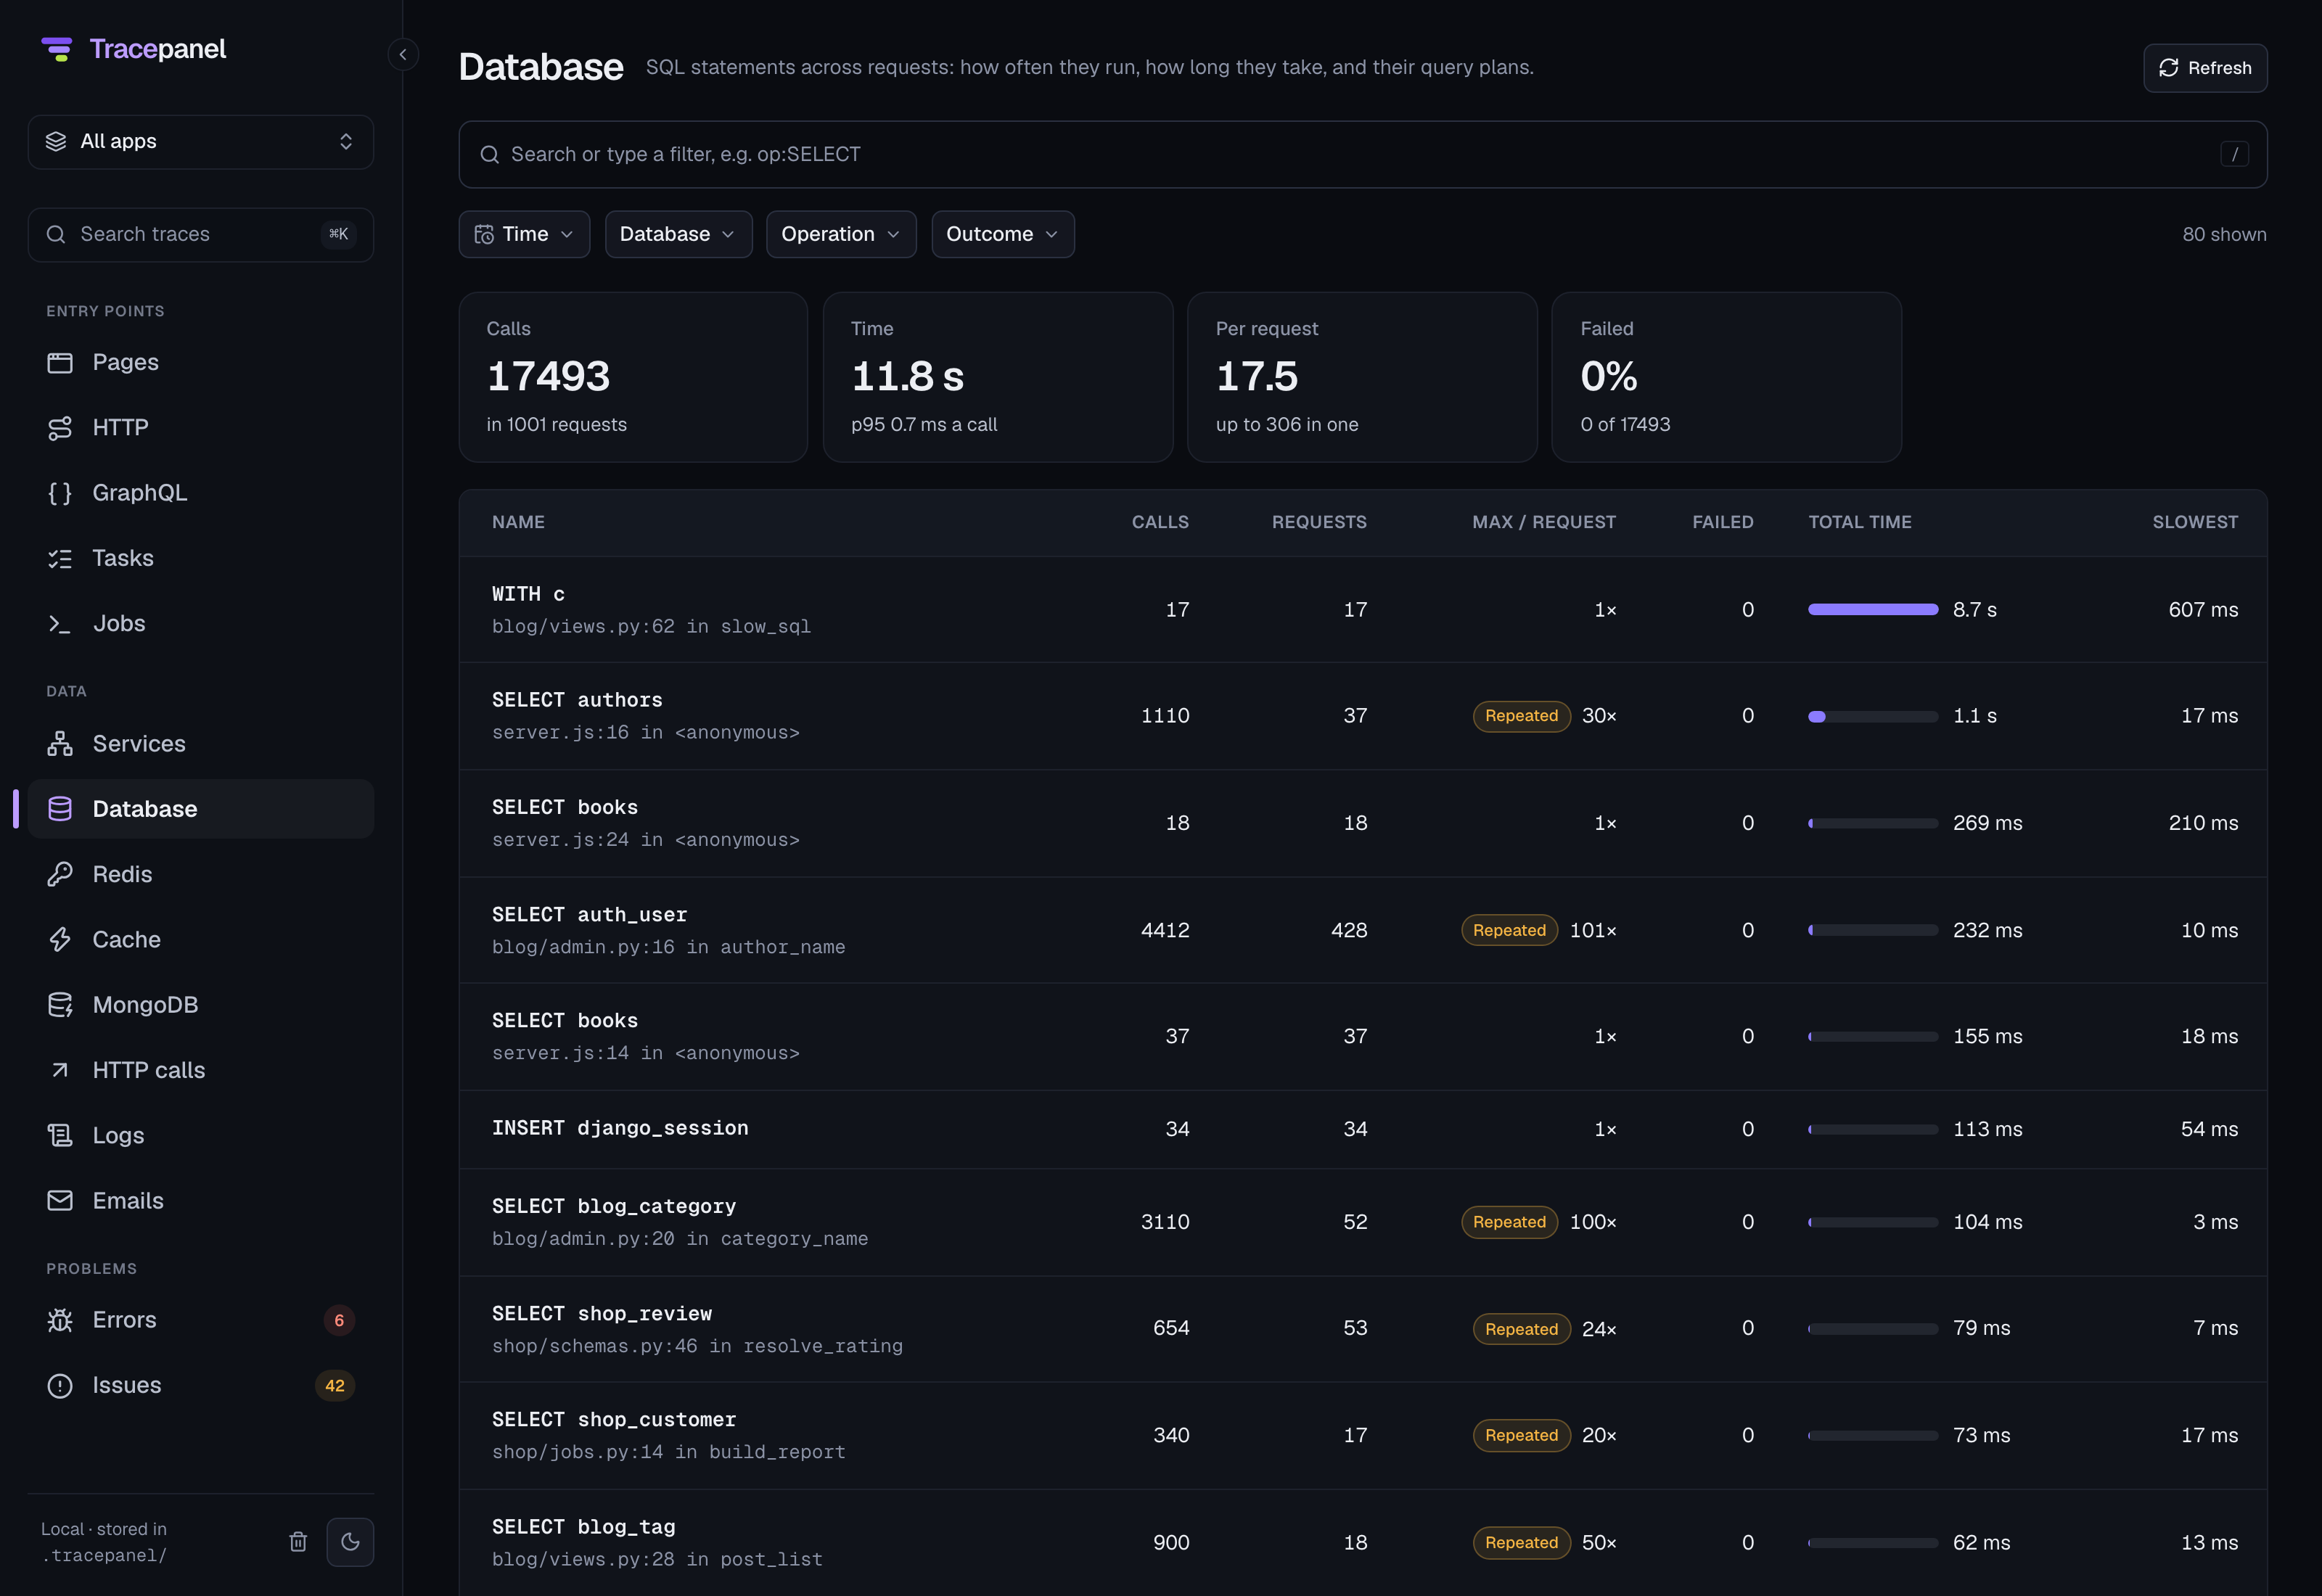
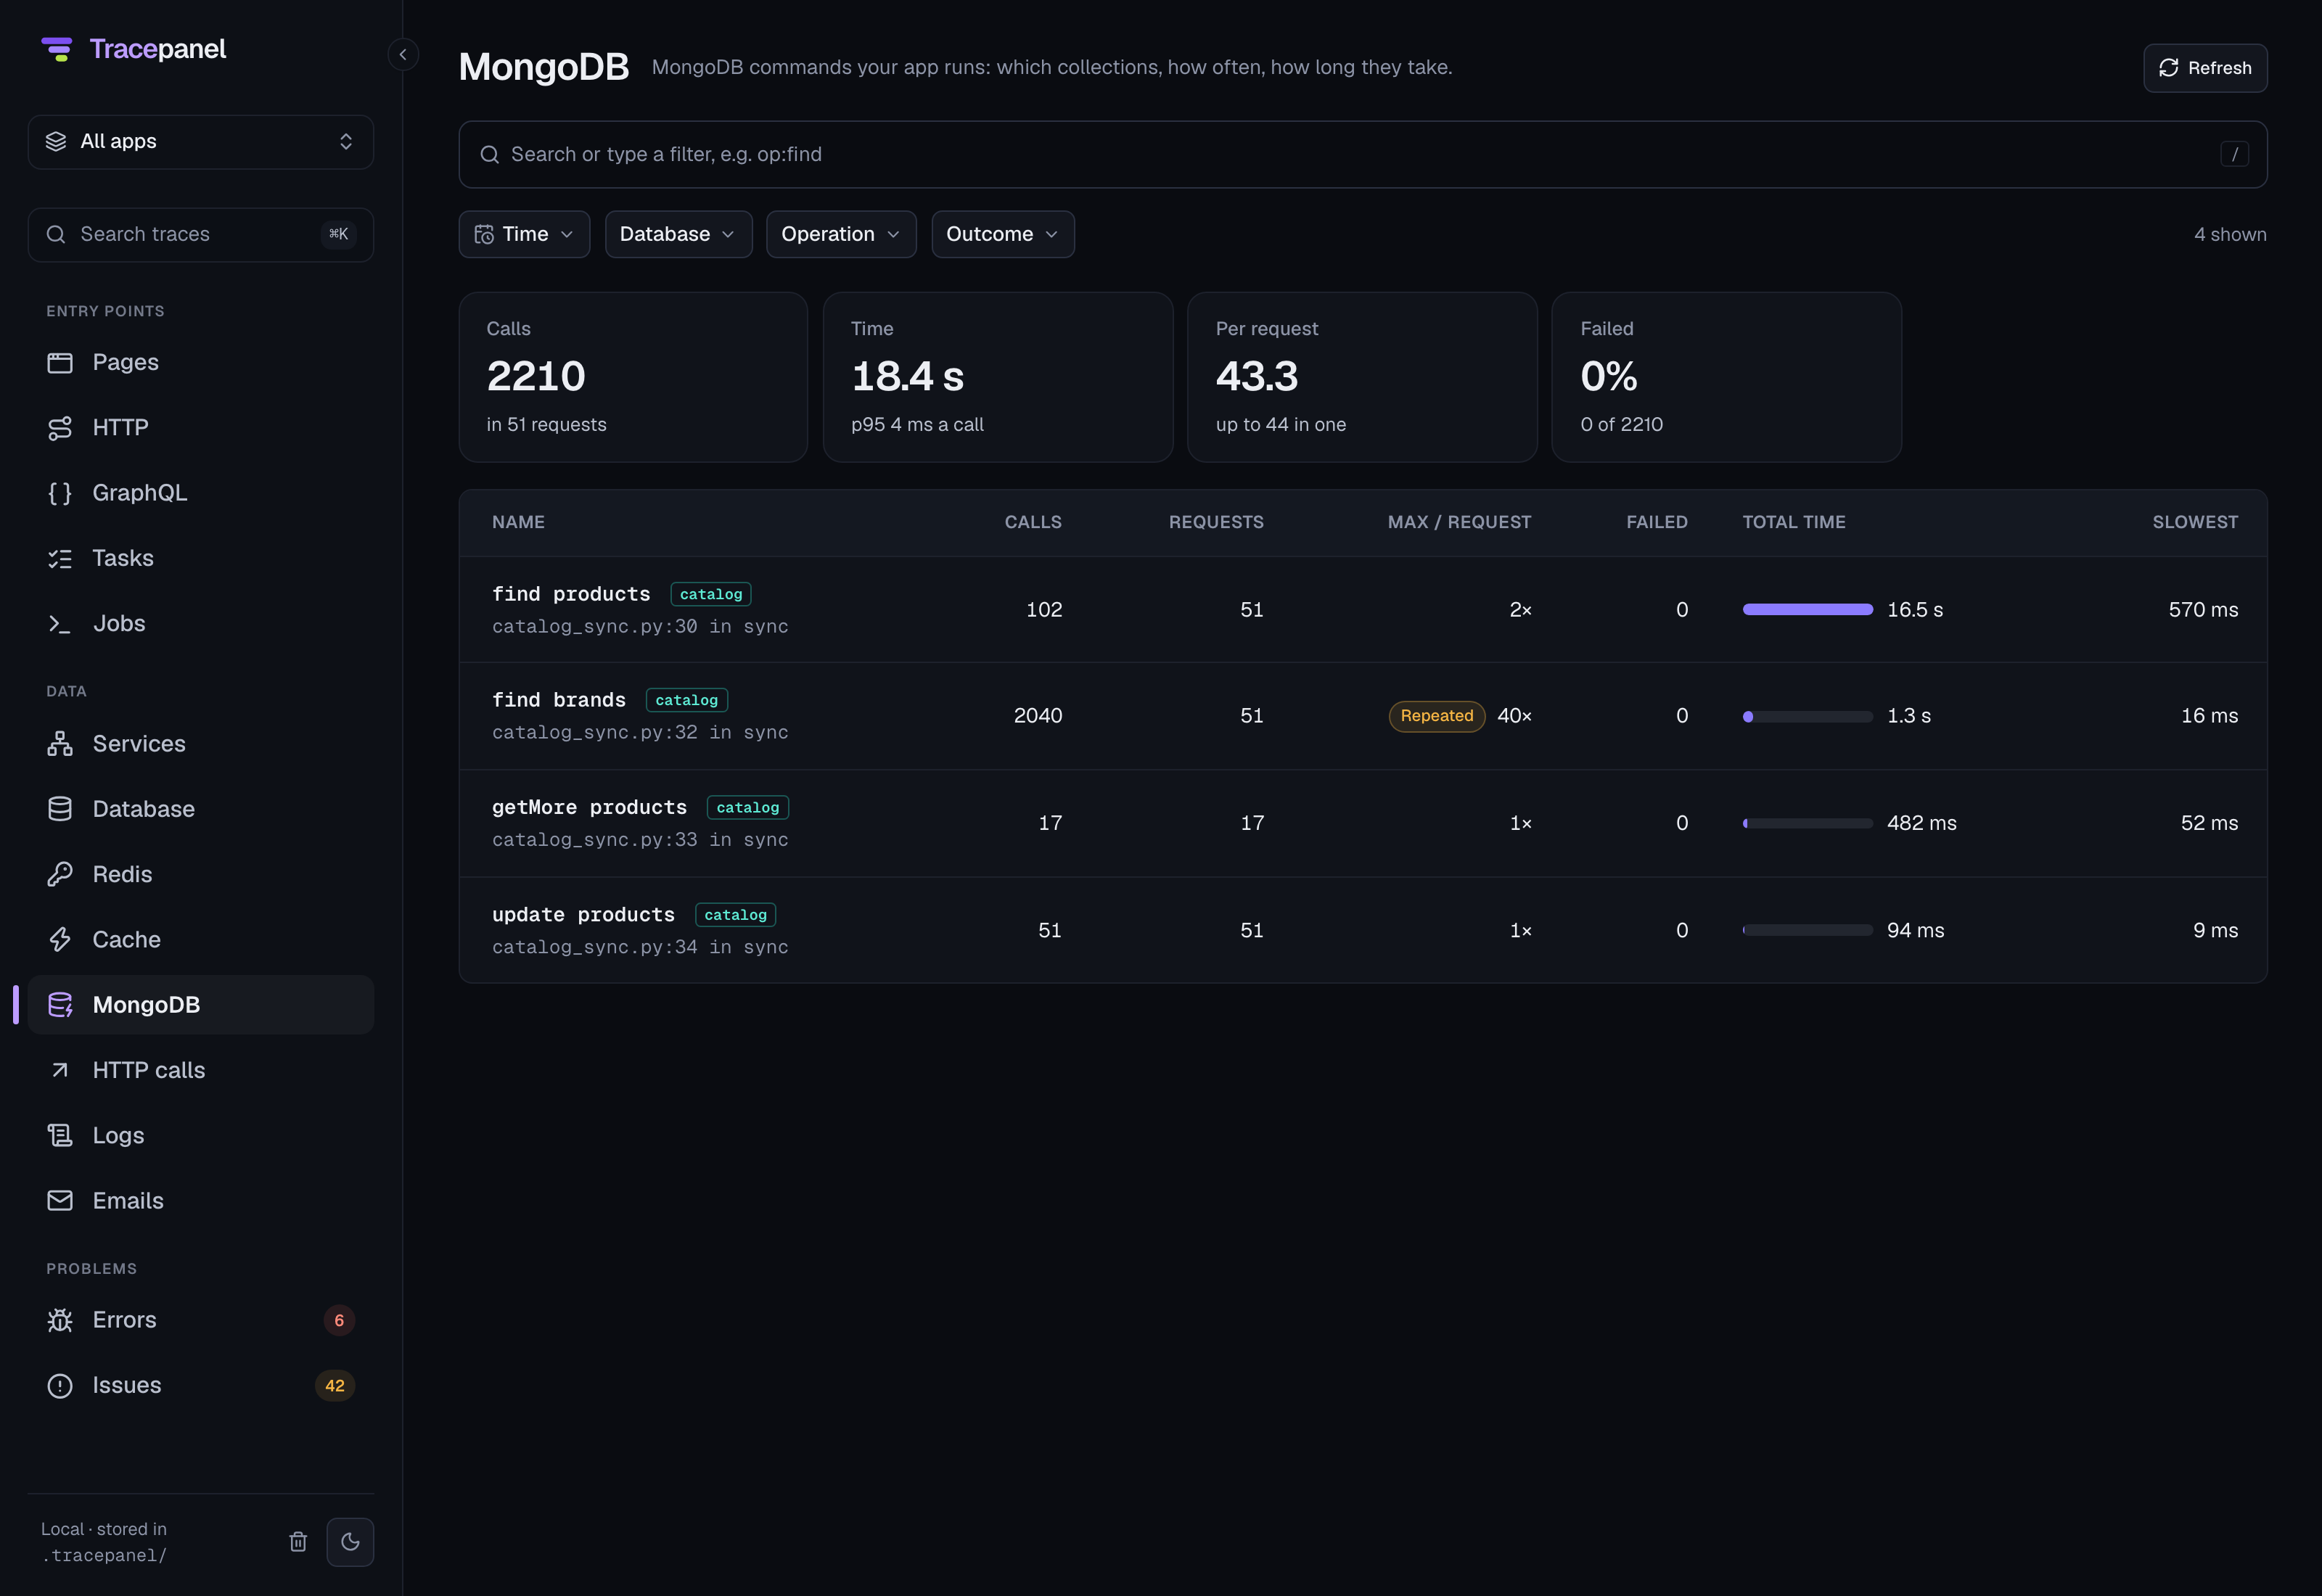
Each system your app called gets a page in the sidebar, once your app has called it. Database lists the SQL statements, and the other pages list the calls to Redis, the cache, outgoing HTTP calls, MongoDB, Elasticsearch, Cassandra, DynamoDB, Memcached, Kafka, RabbitMQ, SQS, gRPC and any other system the agent sees.
Every system page works the same way. It groups the calls by what they repeat,
such as a SQL statement, a key pattern like user:{id} or an endpoint like
GET api.example.com/users/{id}. Each row shows how many calls ran, in how
many requests, the most in one request, the failures, and the total and
slowest time. A row opens the requests that made the call. A SQL statement
also shows its query plan.
Tiles above the list sum up the calls: how many, in how many requests, their time and p95, how many per request, how many failed and, for a cache, the hit rate. The filters next to the search box narrow the page by time, target, operation and failed calls. On the Redis page, Via also tells whether the app, a cache or a task queue sent the command.
Problems
- Errors lists exceptions from requests, tasks and jobs. Tracepanel groups the same exception type from the same place into one row.
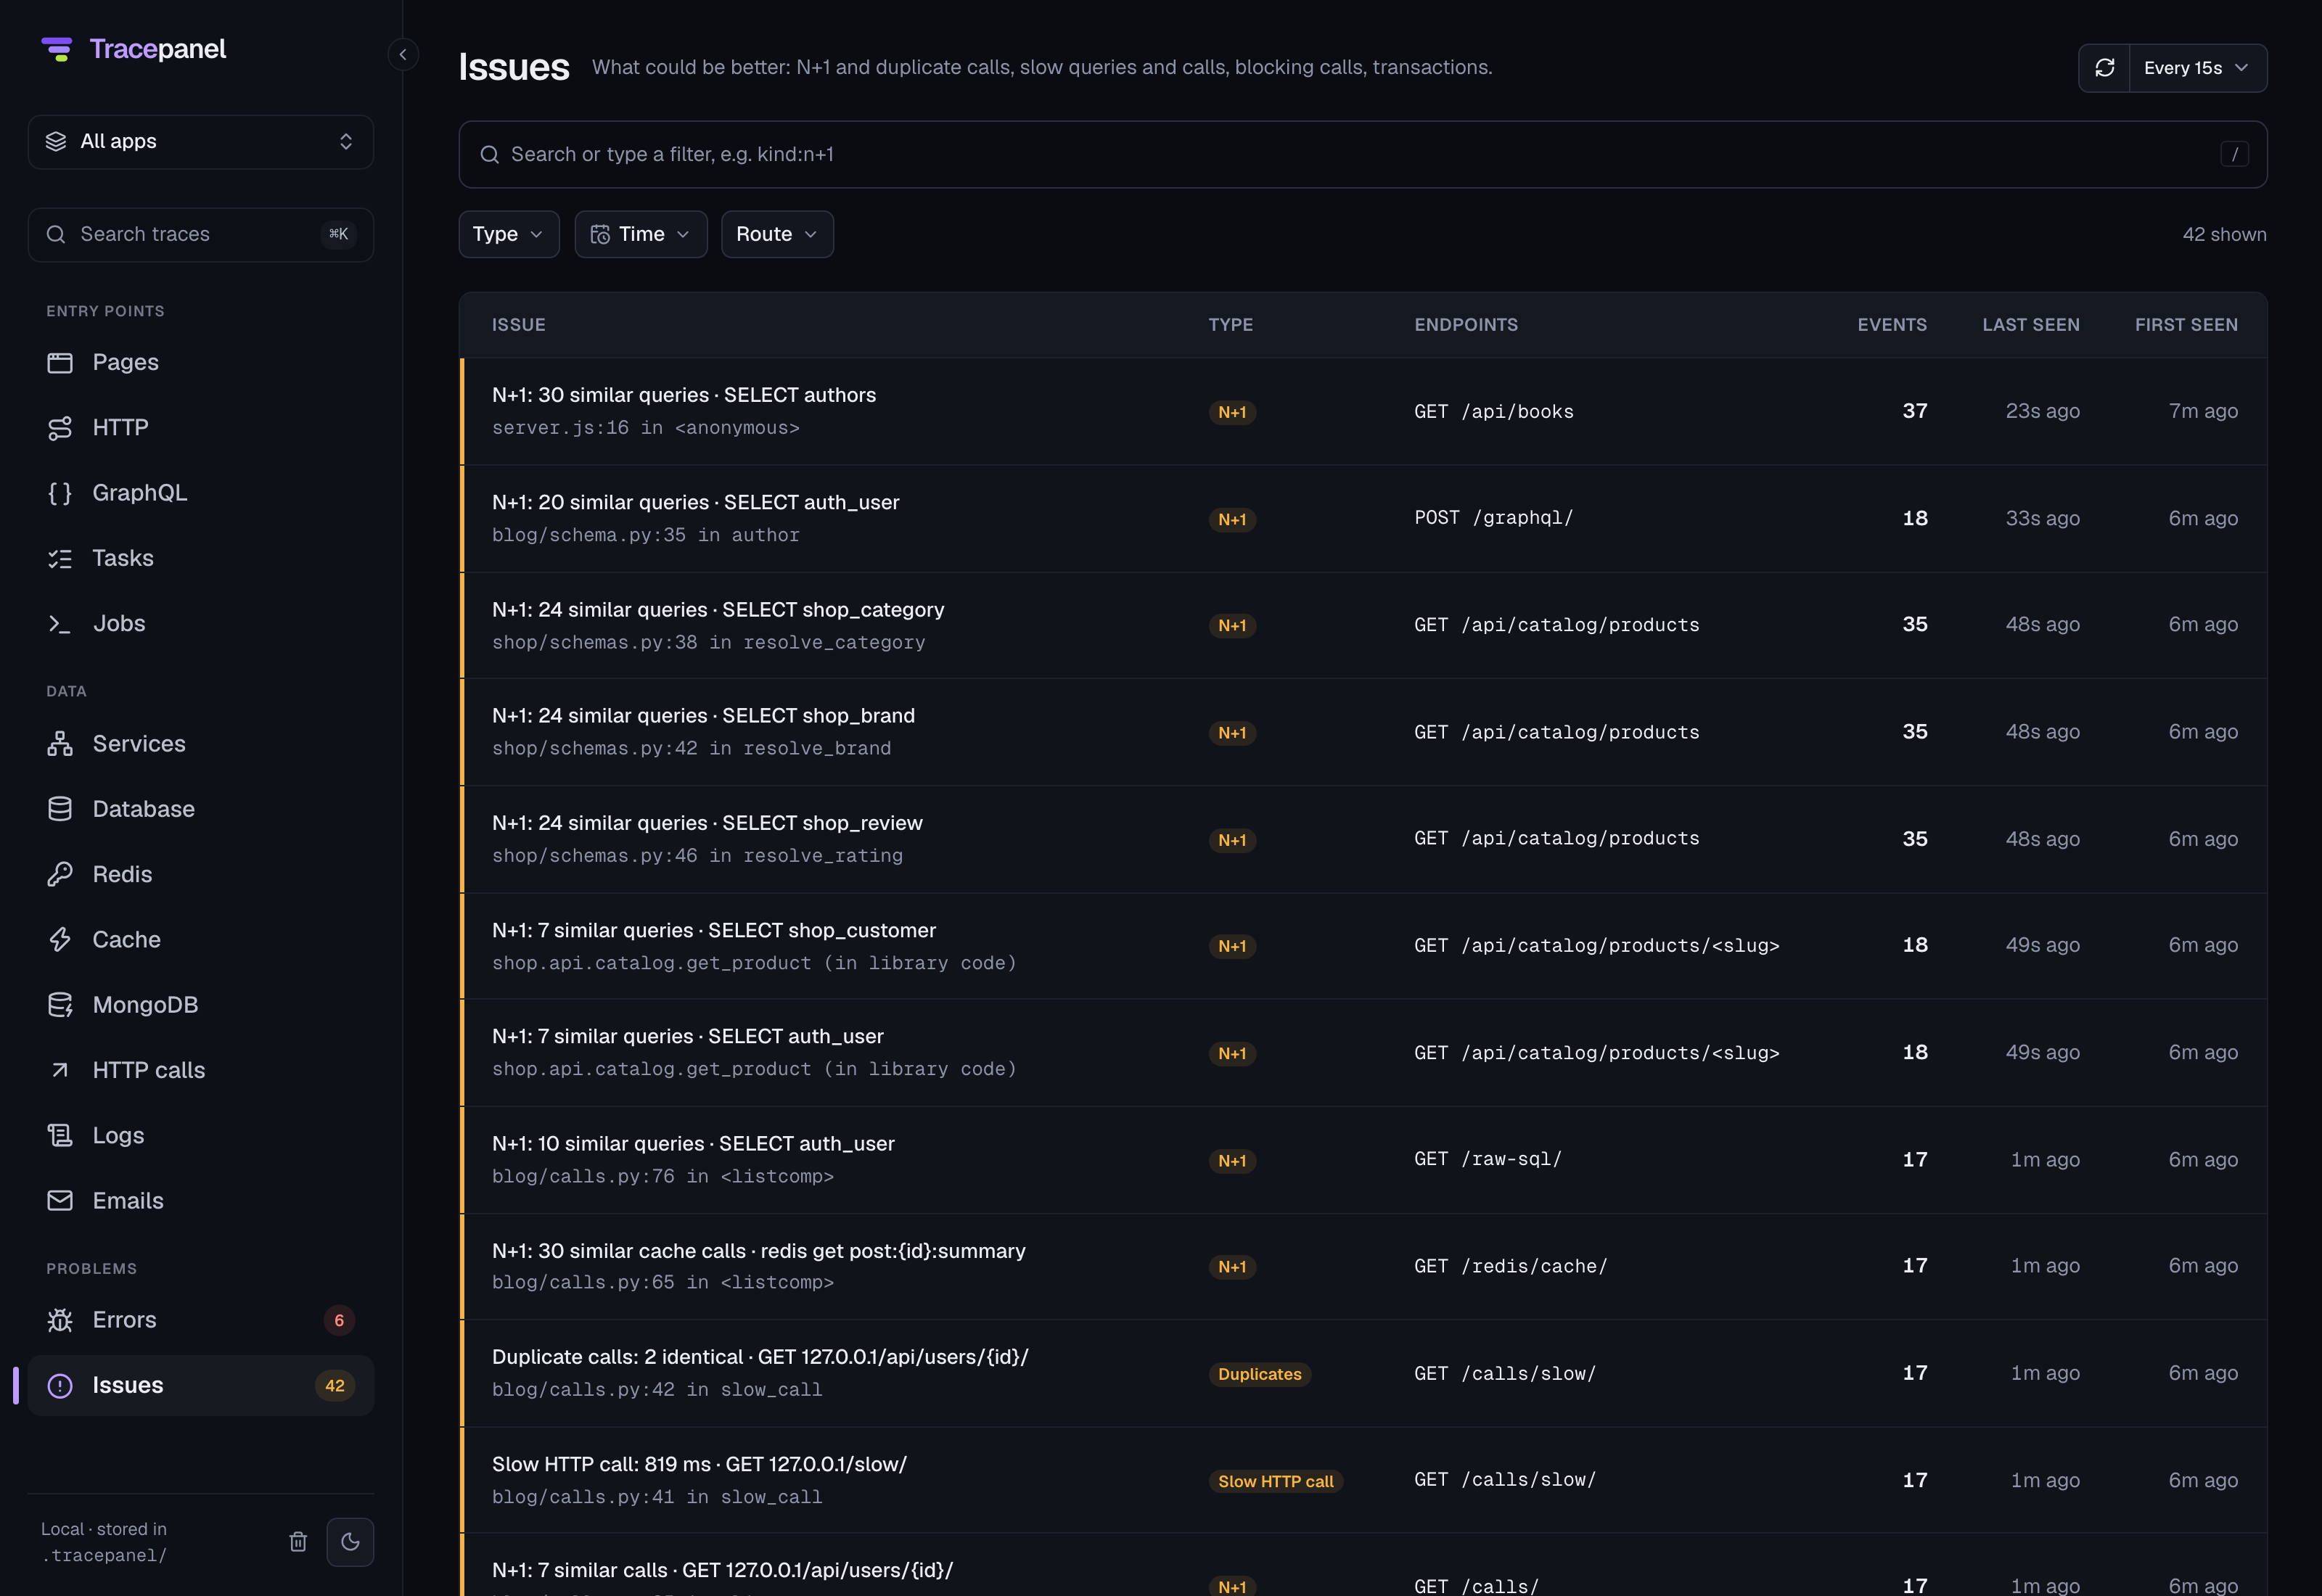
- Issues lists N+1 queries and calls, duplicates, slow SQL, slow HTTP and datastore calls, large results, blocking calls, queue waits, long transactions, work before commit and htmx mistakes. Each row shows the endpoints it happens on, how many times it happened, and when Tracepanel saw it first and last. See Issues.
The sidebar shows the number of errors in red and the number of issues in amber. An error or an issue opens a page with its chart, its latest occurrence and every request it happened in.
Search
Every list has a search box. It takes free text and filters. A filter is a key, an operator and a value:
status>=500 route:/api/* duration>500msThese are the operators:
| Operator | Meaning | Example |
|---|---|---|
: | equals | method:POST |
!= | doesn't equal | state!=success |
>, >=, <, <= | compares a number, a duration or a level | queries>20 |
A text value takes * as a wildcard, as in task:newsletter.*. A comma means
any of the values, as in method:GET,POST. Put a value with spaces in double
quotes. A duration takes us, ms or s, and a bare number means
milliseconds.
since: and until: take a time ago, such as since:15m, since:2h or
since:1d, or a local date and time, such as since:2026-10-07T13:30.
Type a key and the box suggests the rest. After route:, logger:, db:,
task: or queue:, it suggests values from the stored data. Finish a filter
with a space or Enter to turn it into a chip. The menus next to the box add
common filters, such as Status, Duration or Issue.
Each list has its own keys:
| List | Keys |
|---|---|
| Pages | page |
| HTTP | route, method |
| GraphQL | operation, type, route |
| Tasks | task, queue, state, system |
| WebSockets | consumer, event |
| Jobs | job, source |
| RPC | rpc, system |
| Services | kind, system, role |
| Database and the other systems | target, db, host, op, failed, via, system, family, key |
| Logs | level, logger, trace, in, span, span_id, template, route, path, user, extra.* |
| Emails | to, from |
| Errors, Issues | kind, route |
| All calls of an entry point, and ⌘K | kind, method, route, path, view, status, duration, queries, user, has, db, cache, call, peer, trace, name, span, operation, task, queue, state, system |
Every list also takes service, since and until.
On a system's page, target is where the call went: a database, an instance,
a host or a topic. db and host are other names for it. op is the
operation, such as op:select or op:find, and failed:true keeps the calls
that failed. In a trace search, call: finds the traces that made one call
from a system's page, by its key. span: finds the traces with a span or a
call of that name, as in span:shop.views.*.
has: finds traces with an issue or with some content. Its values are n+1,
duplicates, slow-sql, slow-http, slow-call, long-transaction,
in-transaction, htmx, queue-wait, blocking-call, large-result,
error, issues, logs and mail.
Some examples:
status>=500 since:1h
route:/api/* duration>500ms
task:newsletter.* state:failure
has:n+1 queries>20
has:blocking-call
user:42
Search from anywhere
Press ⌘K or Ctrl+K to search every trace, wherever it came from. A trace id
opens that trace. Text searches trace names and paths, and filters such as
status>=500 work too. Search all lists every match. Go to lists
every page of the sidebar, each system's page included. The panel has the same
search.
Several apps
Each app that sends traces to the same agent has its own name, its service. In
the Python SDK, the service setting sets it and defaults to the name of the
project's directory. When the store holds more than one app, the sidebar shows
a switcher under the logo. Pick All apps or one app, and every page of the
console shows only that app. The service: filter does the same in one
search, as in service:shop.
The trace page
Every trace opens on a page of its own. The page has the same tabs as the panel: Request, Call tree, Error, Issues, DB, Cache, HTTP calls and Logs. It also shows more at the top:
- the method and path, the status and the time, and the route when it differs from the path
- the duration with the database's share of it, and a tile for each system the trace called, with its calls and time
- a timeline with a lane for the request, SQL, Redis, the cache, datastores, messaging, HTTP calls, RPC, logs and errors, where an N+1 burst is amber and an error is red. Click a mark to open it in the call tree, the logs or the error.
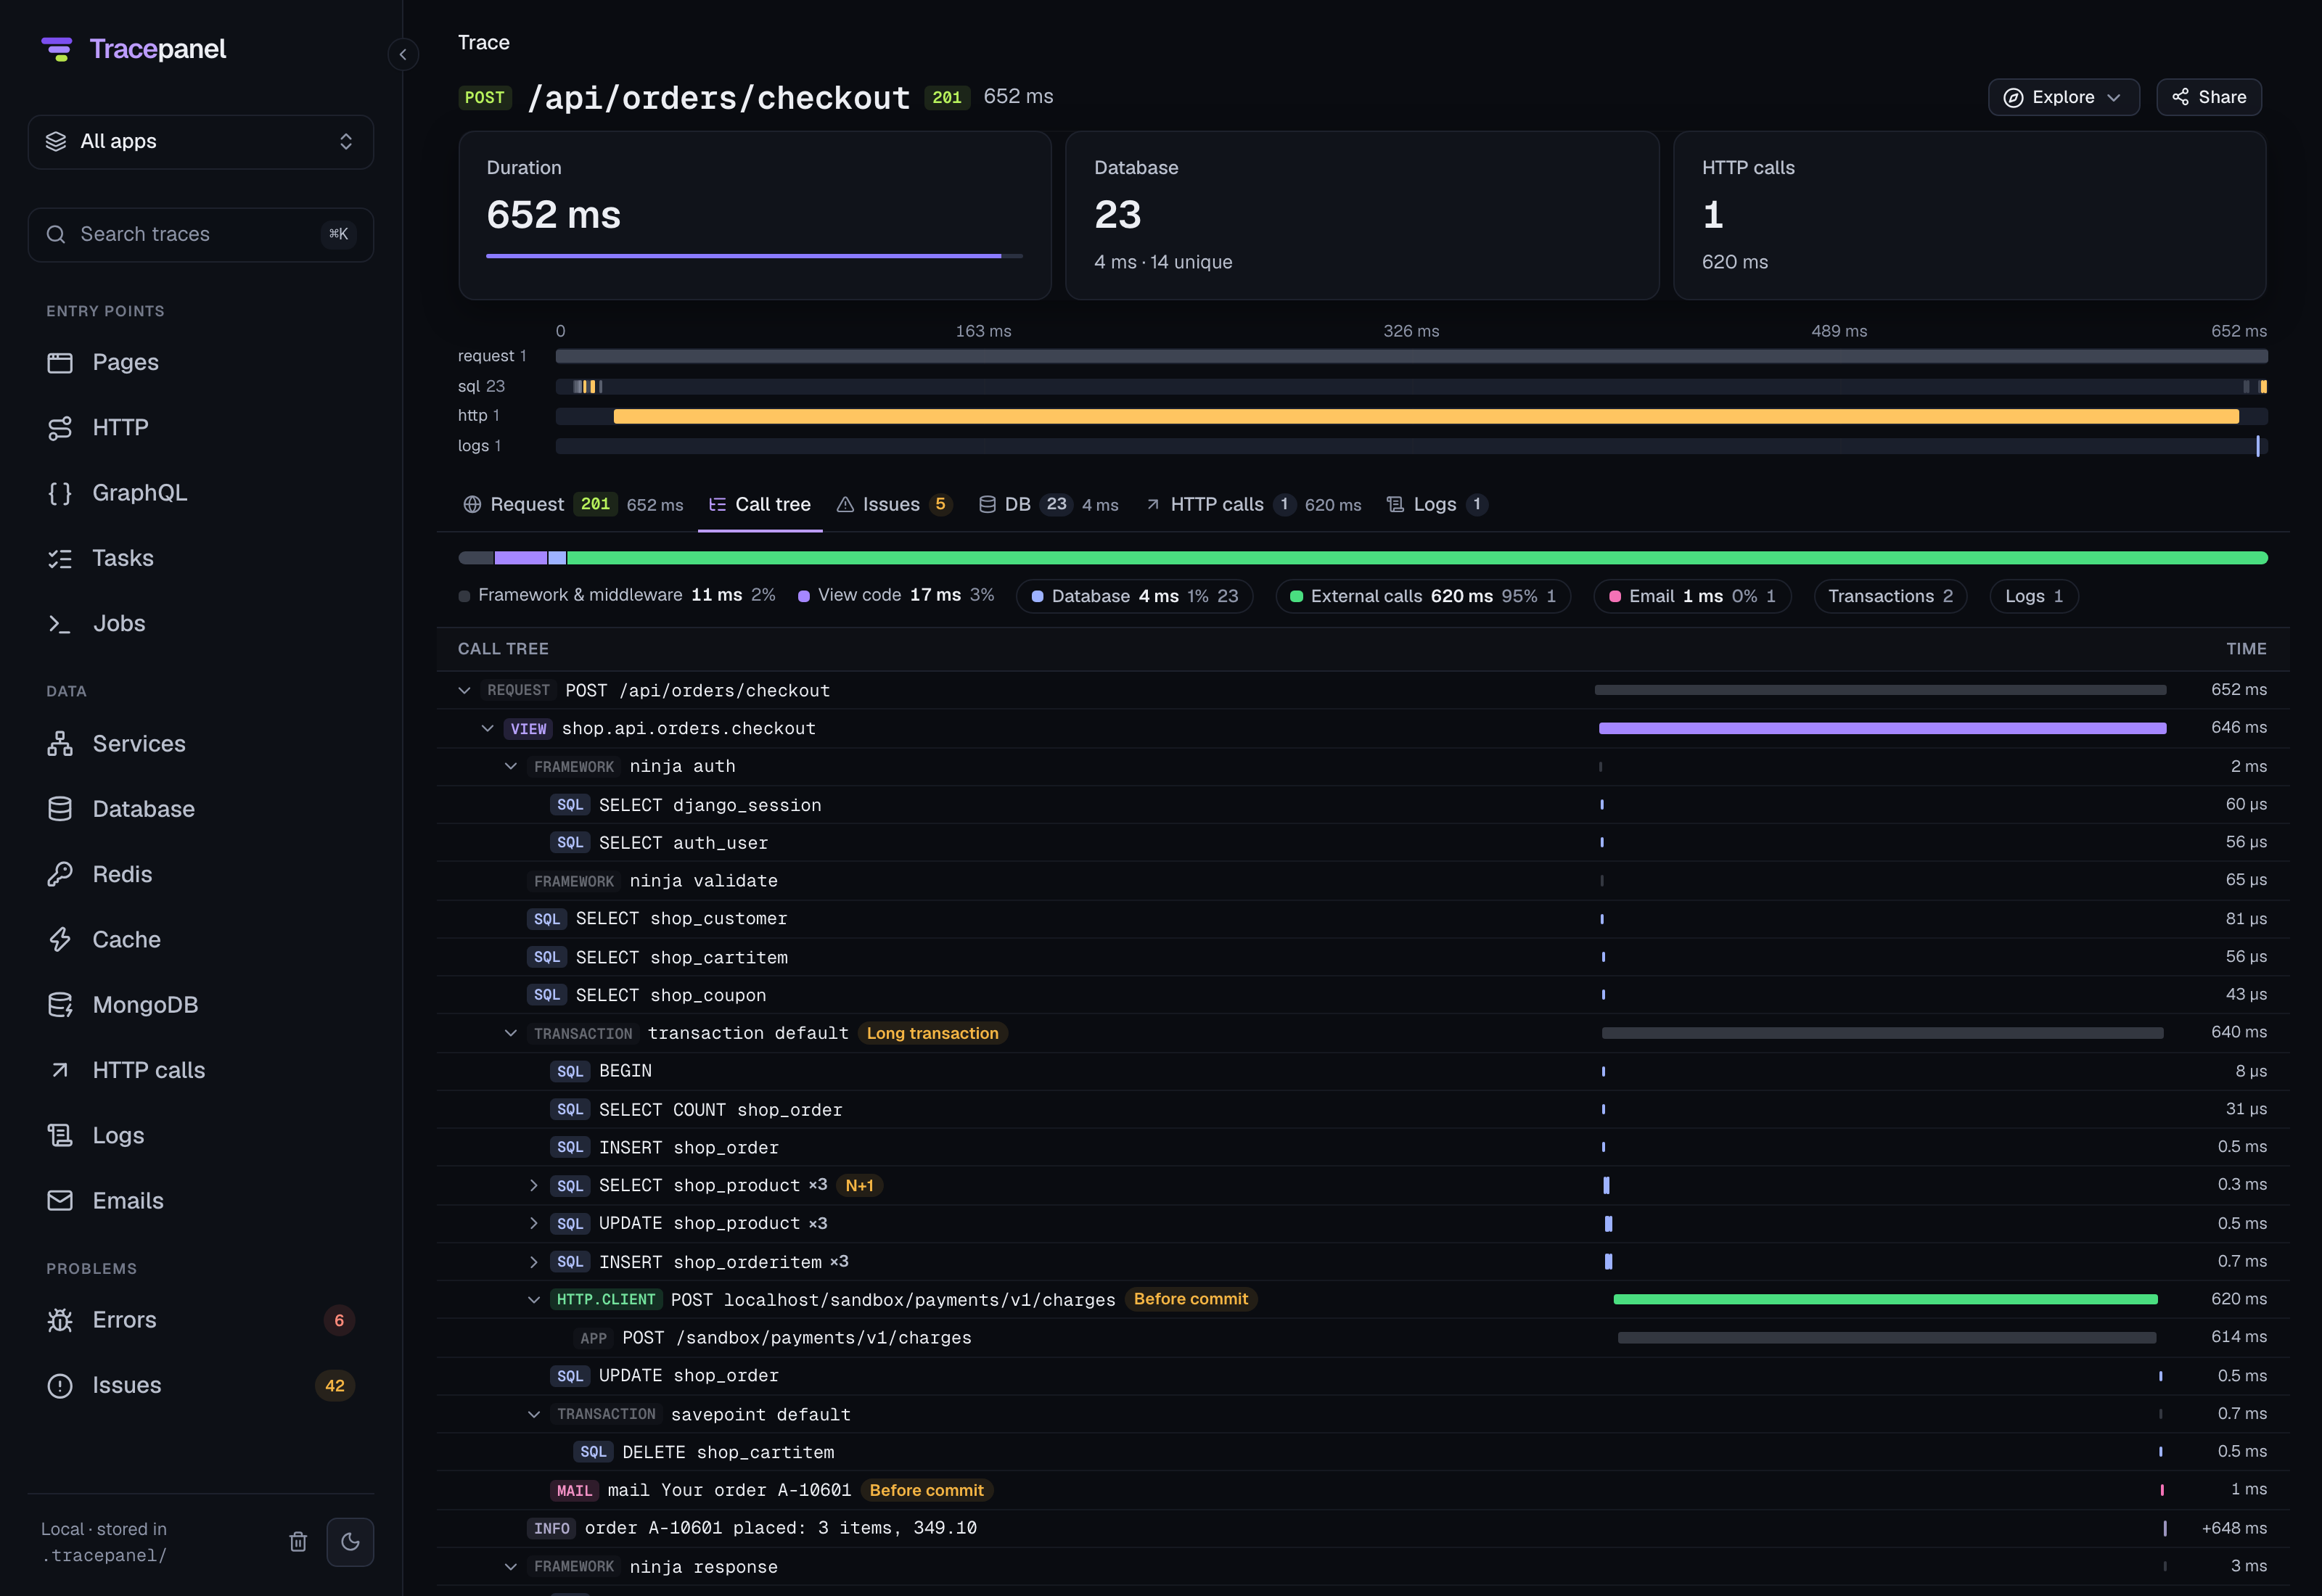
The address of the page keeps the open tab, so a link to a trace's call tree opens on the call tree. The breadcrumbs lead back to the list you opened the trace from. Explore leads to every call of the same endpoint or task, to the trace's issues across all requests, and to the logs of every process 30 seconds before and after the trace.
Sharing a trace
Share on a trace's page, or its icon in the panel, opens a dialog that downloads the trace as one HTML file. The file holds the traces linked to it too: the request that queued it, the tasks it queued, and the traces it called or was called by. The file holds the console as well, so it opens in any browser with no agent and no network. Send it to a teammate, or attach it to a pull request or a bug report. It opens read-only on the trace, under a bar that says when the snapshot was made.
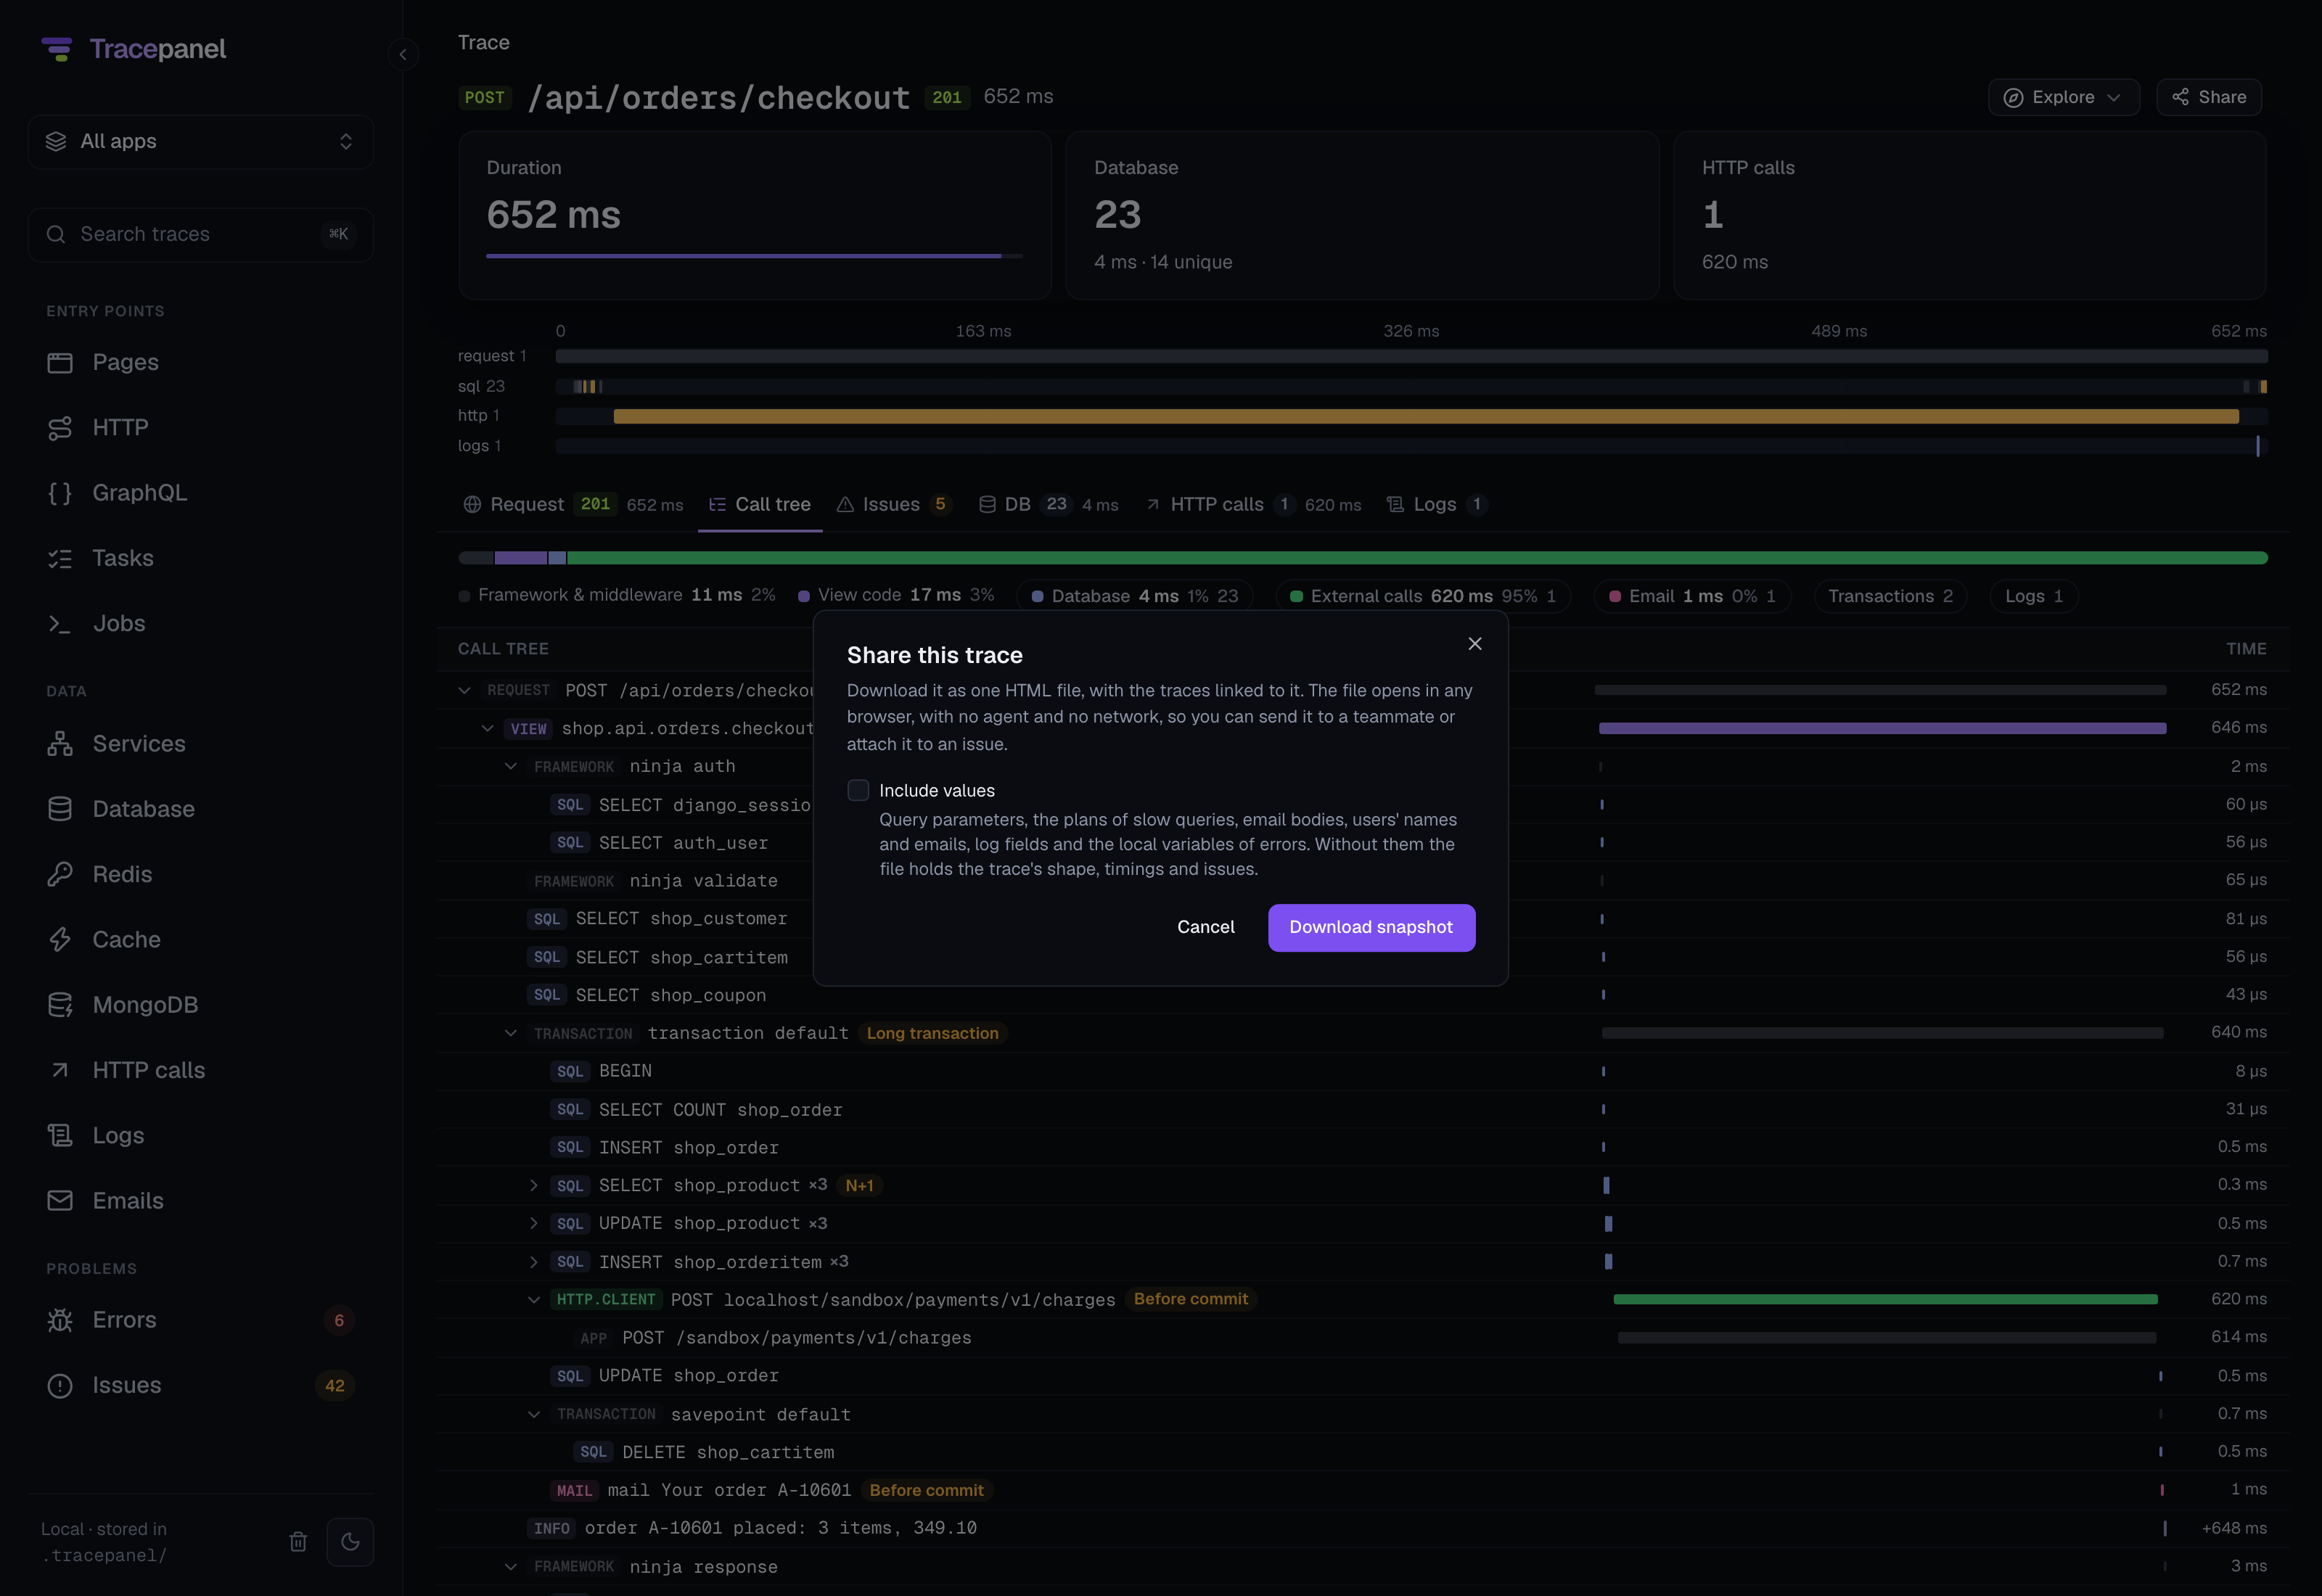
By default the file leaves out what stays on your machine: query parameters, email bodies, a user's name and email, the fields of log records and the local variables of errors. Include values keeps them, and adds the plans of the trace's slow queries, which only your app can run. Values can hold secrets, so look at the trace before you share it with them.
Refreshing and clearing
The lists reload on their own while the page is visible, every 15 seconds by default. The refresh control sets the interval or turns auto-refresh off, and it can reload at once. The console remembers your choice. Services and the system pages reload only when you ask.
The sidebar's footer shows that the data is local and stored in
.tracepanel/. The trash button there deletes every stored trace with its
logs, queries, emails and issues. You confirm it with a checkbox, and it can't
be undone. Press ⌘B or Ctrl+B to fold the sidebar to a rail of icons.