Logs
Tracepanel captures your app's log records with no extra setup and attaches each one to the request, task or command that wrote it.
Tracepanel captures the log records your app already writes. You add no handler and change no logging configuration. The SDK attaches each record to the request, task or command that wrote it.
What Tracepanel keeps
Tracepanel keeps the records written while a request, a task or a command runs. Each record belongs to that trace, and to the span it was written in, such as a view, a SQL query or a Kafka send. The record also knows every span around that one, up to the request, so you can find it by any of them. Records written outside a trace, such as at startup, aren't kept.
A trace keeps its first 1000 records. The Request tab shows how many more the app wrote, under Not recorded.
Each record keeps these values:
- the time, the level and the logger name
- the message, with its arguments filled in, and the message template when it had arguments
- the function, file and line that wrote it
- the thread name and the process id
- the traceback, when the record carries an exception
- every structured field passed with the record
Tracepanel stores each structured field under extra., such as
extra.order_id. You can search and filter the records by these fields.
Masking
Tracepanel masks a structured field whose name looks secret, such as a
password, a token or a key. It stores ******** in place of the value. For
example, a field named api_key becomes extra.api_key with the value
********. Tracepanel doesn't mask the message text itself, so keep secrets
out of the message.
In the Python SDK
The Python SDK reads records from the standard logging module. It adds no
handler to any logger, so basicConfig(), Django's LOGGING and a worker
that takes over the root logger all work as before. A logger's level still
applies, so a logger at INFO doesn't pass its DEBUG records to
Tracepanel.
Pass structured fields in extra= as usual:
import logging

logger = logging.getLogger(__name__)

logger.info("Order paid", extra={"order_id": 42, "amount": 990})
The SDK skips its own records, the SQL echo, the task queues' per-task lines
and server access logs. The ignore_loggers setting skips more loggers. See
Integrations for the details.
Logs in the panel
The panel's Logs tab lists the records of the selected request. Click a record to see its message and every field, as in the call tree. In the call tree opens the call tree at the span a record was written in. See The panel.
The Logs page
The console's Logs page lists the records of every request, task and job, newest first. Each row shows the time, the level, the message, the logger and the request.
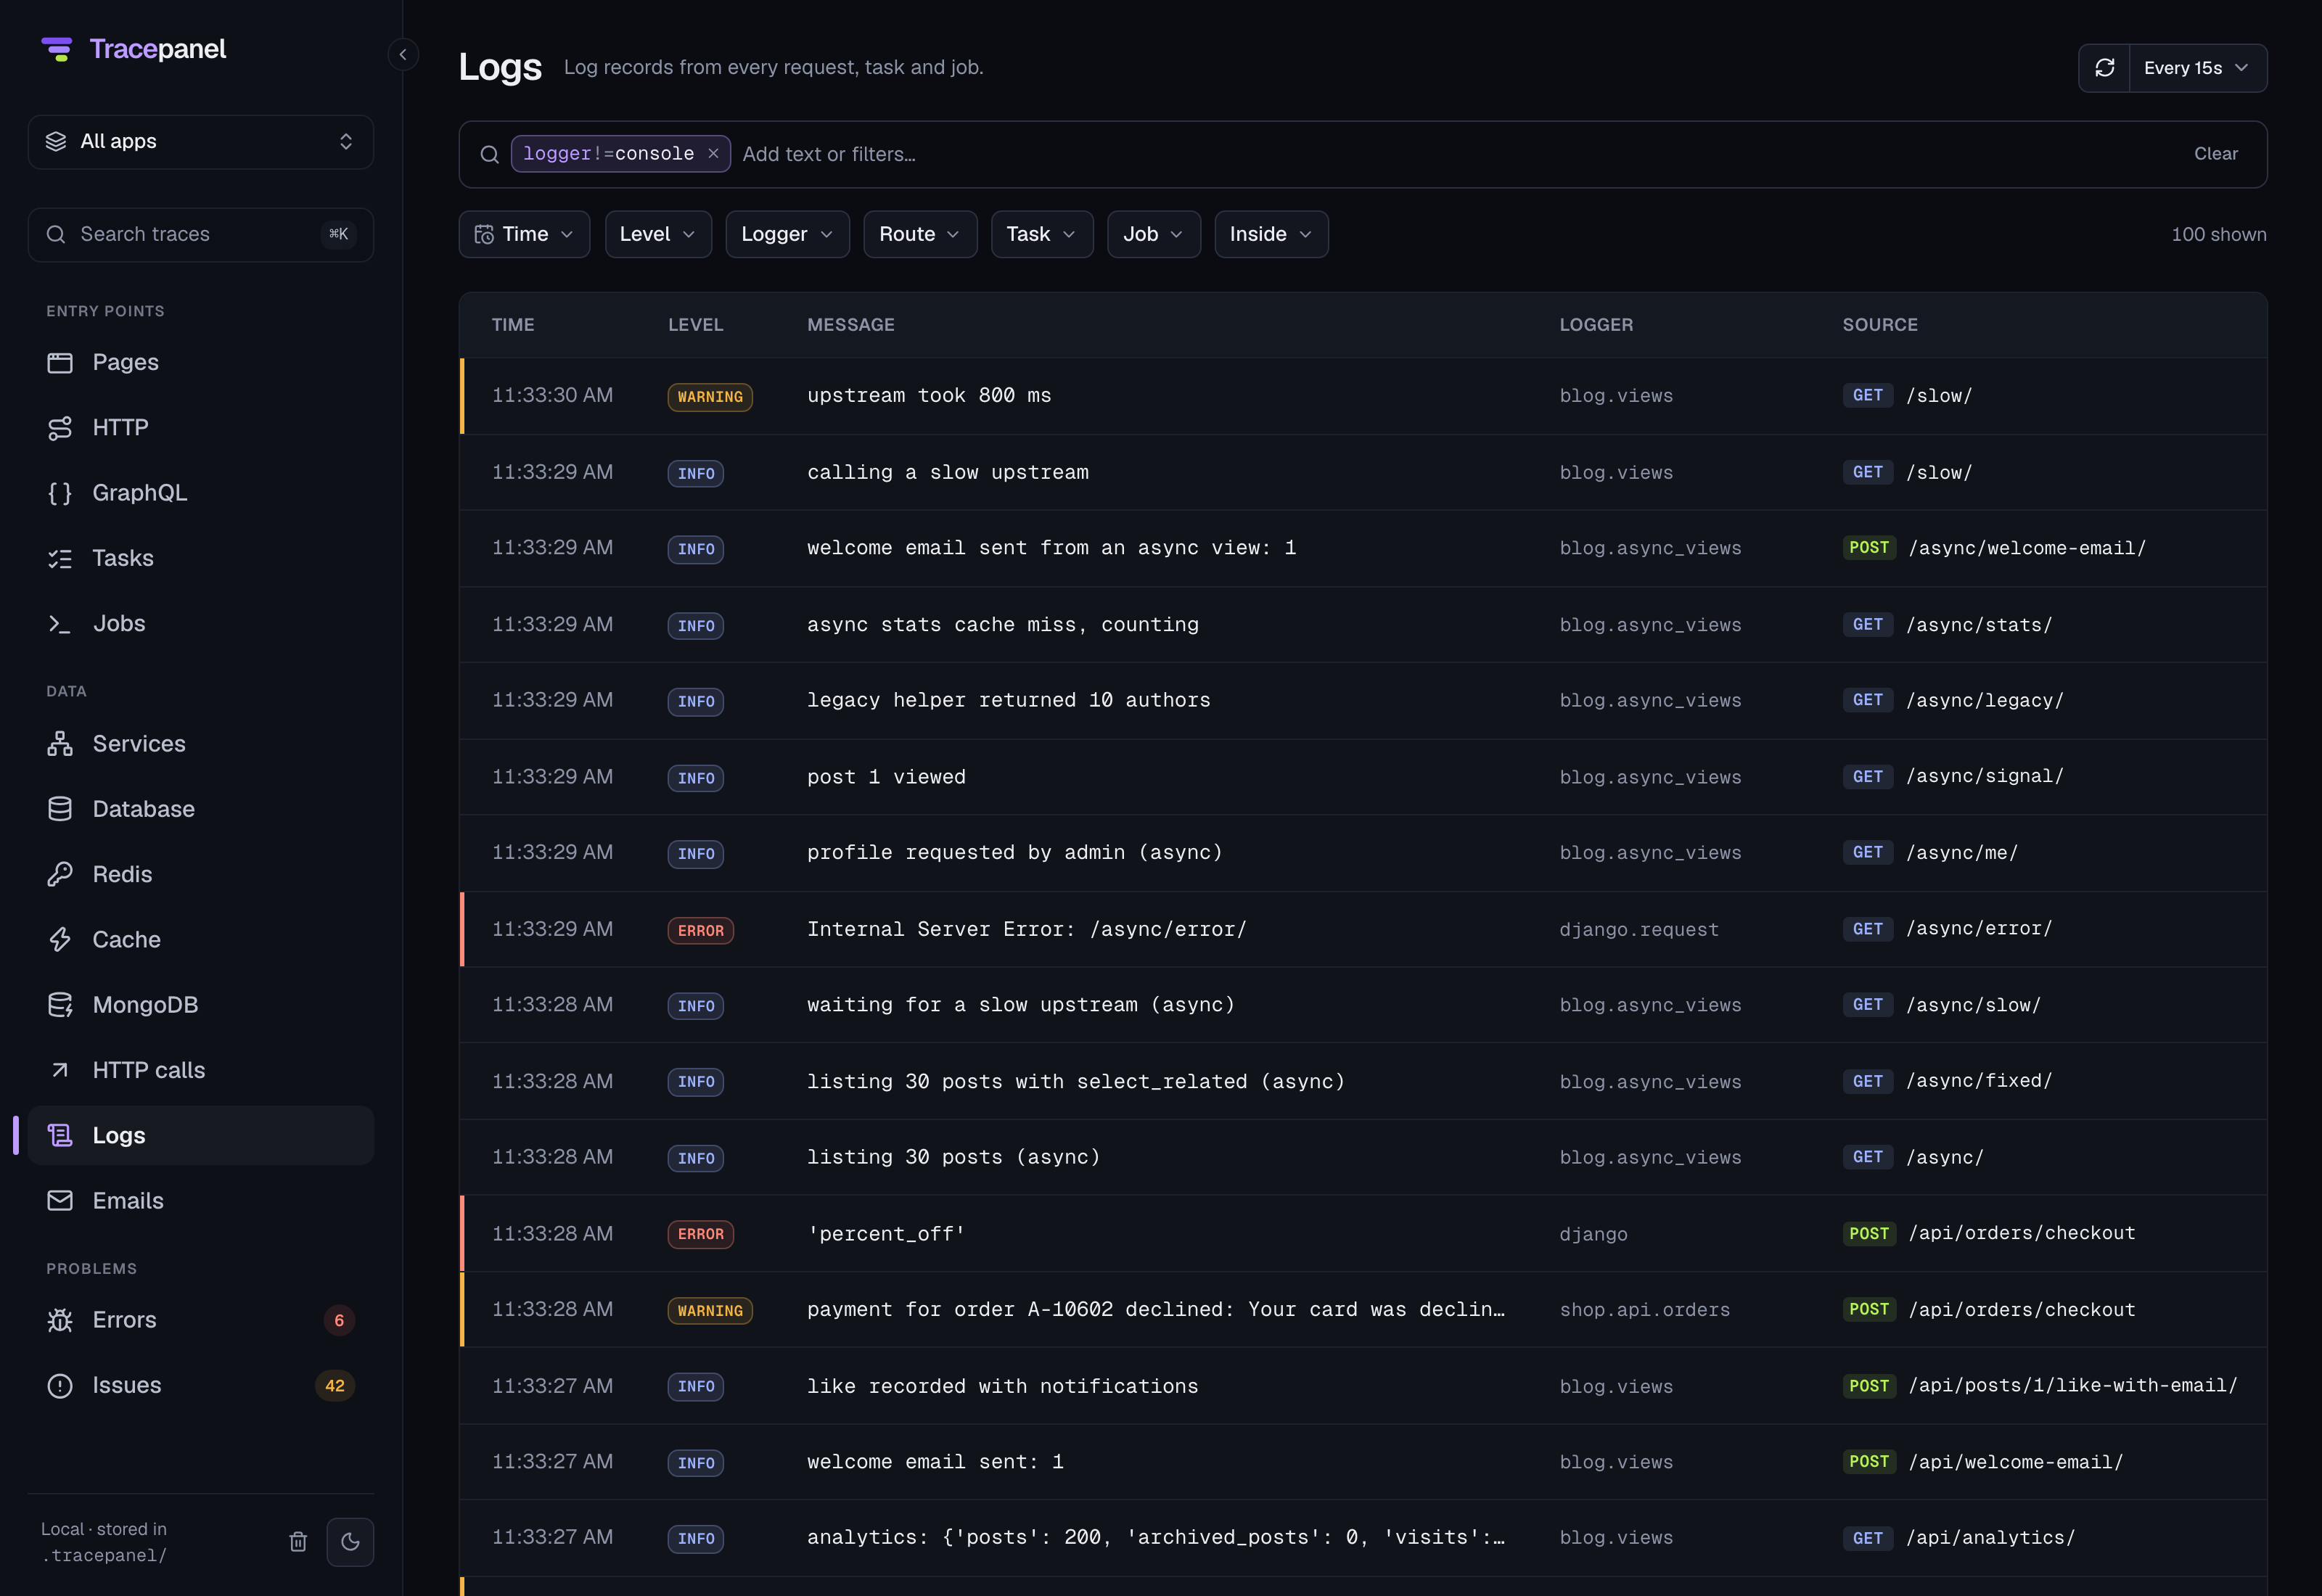
Open a record to see its message, its traceback and every field. The details
also name the app, the request with its status, the user and the span it was
written in. Buttons there
show the logs from this request, this logger, this path or this user. A filter
button next to an extra. field shows the records with the same value.
Open request opens the record's trace on its Logs tab.
The menus next to the search box filter by time, level, logger and route.
Search keys
Free text searches the message. To match a logger, use the logger key. The
page also takes these keys:
| Key | What it matches | Example |
|---|---|---|
level | The level: debug, info, warning, error or critical. Compare with >= and the other operators. | level>=warning |
logger | The logger name, with * wildcards. | logger:blog.* |
trace | The trace id. | trace:<id> |
in | The kind of call or span the record was written inside, at any depth. | in:kafka, in:sql |
span | The name of a span the record was written inside, with * wildcards. | span:shop.views.* |
span_id | The id of the span the record was written in. | span_id:<id> |
template | The message as written, before its values were filled in. | template:"Order {} paid" |
route | The route of the request that wrote the record. | route:/api/orders/* |
path | The path of the request that wrote the record. | path:/api/orders/7 |
user | The user id of the request that wrote the record. | user:42 |
extra.* | A structured field of the record. | extra.order_id:42 |
service | The app that recorded it. | service:shop |
since, until | When the record was written. | since:15m |
Text keys take * wildcards, != and a comma for any of several values.
Combine keys with spaces:
level>=warning logger:blog.*
level:error route:/api/* since:1h
extra.order_id:42
logger!=blog.audit user:42
in:kafka level>=warning
payment failed since:2026-10-07T13:30
From a trace, Explore opens the logs of every request, task and job from 30 seconds before the trace to 30 seconds after it. See The console for the rest of the search syntax.